Hello! My name is Sarah O’Brien and I’m a rising Junior and Computer Science major at Northwestern University. I’m working with Maria Chan at Argonne and Eric Schwenker (PhD candidate in Materials Science and Engineering) at Northwestern on developing an automated process to create large training sets for image-based machine learning models.
Having large datasets with labeled classes or features is vital for training deep neural networks – and large datasets, particularly in the field of materials science, are often not publicly available. As such, without an automated workflow, organizing and labeling large sets of images is extremely time consuming and needs to be done manually each time we have a new problem to solve with machine learning.
This summer, we developed an Image Pre-processing Workflow to produce training and test data for our machine learning model. We first obtain many figures and captions from the scientific literature and use string parsing in the caption to decide if a figure is “compound,” i.e. made up of multiple subfigures. If it is, we extract each individual sub-figure with a figure separation tool developed by researchers at Indiana University2. Below is an example of the compound figure separation process.
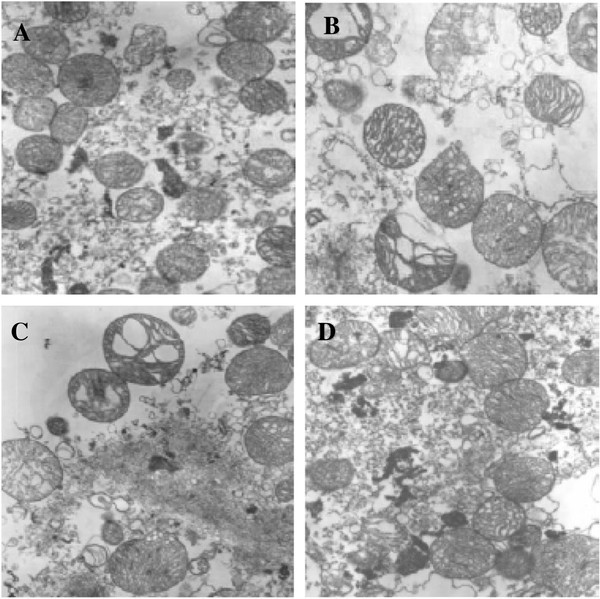
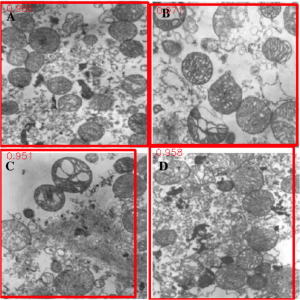
TOP: Original Compound Figure from literature1; BOTTOM: Output of Figure Separation tool
Once we have a set of many separated figures, we decide if each is useful for our training set or not; for example, to create a set of microscopy images we trained a Convolutional Neural Network to create a binary microscopy image/non-microscopy image classifier. We trained this classifier on 960 total hand-labeled images (480 microscopy images and 480 non-microscopy images) and used two approaches: transfer learning and training from scratch. Both methods yielded classifiers with about 94% accuracy using ten-fold cross validation; we are working on making this classifier even more accurate by fine-tuning the models. Together with the figure separator, this trained classifier now allows us access to a large number of individual microscopy images for our future work on training a deep learning model.
My work on this project is important because a working image pre-processing workflow is essential for training a machine learning model. The data pre-processing stage of a machine learning task is often quite time consuming, so to be able to complete the stage automatically will offer us the ability to extract a large amount of information from a collection of images in a relatively short time, and therefore enable automated interpretation and understanding of materials through microscopy.
I’m excited for the future of this project and to see this workflow’s output in action building deep learning tools that will advance scientific collaboration. Special thanks to Dr. Maria Chan, Dr. Jennifer Dunn, and Eric Schwenker for mentoring me this summer.
References:
1: https://media.springernature.com/lw785/springer-static/image/art%3A10.1186%2F2047-9158-1-16/MediaObjects/40035_2012_Article_15_Fig2_HTML.jpg
2: S. Tsutsui, D. Crandall, “A Data Driven Approach for Compound Figure Separation Using Convolutional Neural Networks”, ICDAR, 2017.
Month: August 2018
Keyhole Porosity Formation in Metal Addative Manufacturing
My name is Jacob Hechter, I am a rising Junior at Northwestern University working on a degree in Materials Science and Engineering. This summer I’ve been working with Argonne’s Materials for Harsh Conditions group under Dr. Aaron Greco and Dr. Benjamin Gould on their Metal Additive Manufacturing (MAM) project. Colloquially known as metal 3D printing, MAM is the process of continuously adding material to a part during manufacture until the part has the desired final shape. This is in contrast to more traditional methods of manufacture, such as milling or grinding, which can be referred to as subtractive manufacturing.
This project focused on a type of MAM often referred to as Selective Laser Melting (SLM) Powder Bed Fusion (PBF). This process uses a Computer-Aided Design (CAD) document as a source for the design, where the CAD document is sectioned into a series of layers. The MAM machine deposits a layer of powder on top of a substrate and scans a laser across this layer of powder, to fuse the powder in the shape described by the bottommost layer of the CAD drawing. This process is repeated, up until the last layer in the CAD drawing has been completed. After this process has been completed, you are left with a part that has literally been built from the ground up.
MAM has several advantages over more traditional methods of manufacture. It allows for the construction of parts with much greater complexity than traditional manufacturing methods, allowing for the formation of internal voids and other such characteristics without the requirement to make multiple pieces which must be welded together. It can make complex parts with significantly less wasted material compared to traditional methods of manufacture. It also requires significantly less infrastructure to perform the manufacturing process, since it does not require an entire assembly line which must be retooled every time a adjustment is made to a design or a new part needs to be made. However, MAM has some other quite significant disadvantages when compared to traditional methods of manufacturing. During the MAM process, the material of the part undergoes complex thermal cycling, where it is rapidly heated and cooled by repeated scans within the space of seconds. This results in unexpected microstructures, and the formations of several characteristic defects which can ruin a part. This requires constant individual validation of every single part made via MAM if said part is going to be used in almost any application, making MAM produced parts significantly more expensive.
The overall focus of this project is to record in-situ X-ray transmission and IR videos of the MAM process, in an attempt to better understand its behavior and provide tools which can be used to avoid defect formation. The X-ray transmission analysis results in very high spatial and temporal resolution videos, allowing us to record data at hundreds of thousands of frames per second and pixels which are less than 2 microns wide. These videos give a fairly good picture of what is happening physically to the sample during the MAM process, and an example of one of these videos is shown in Figure 1. However, the only reason why we have these sorts of X-ray videos are because of our use of the Advanced Proton Source, and these videos can only really be obtained with relatively thin samples, so it is highly impractical to suggest these X-ray videos as a source of diagnostic of feedback for MAM. On the other hand, pretty much every industrial machine has some sort of IR camera attached to it. If behaviors and defects seen in X-ray can be linked patterns in IR videos (example in Figure 2) then it may be possible to use the IR cameras as a diagnostic tool, giving MAM machines feedback during the process to avoid defect formation and reducing the need for exhaustive validation.
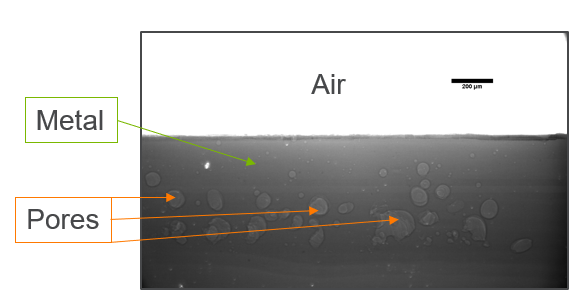
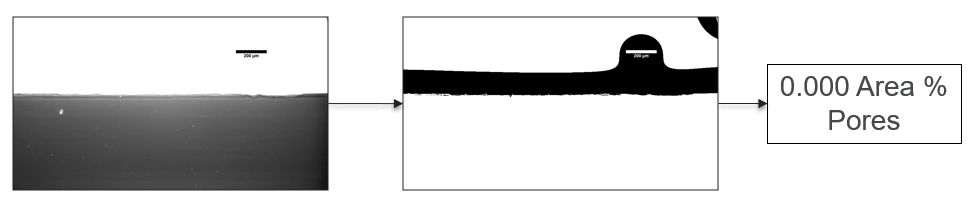
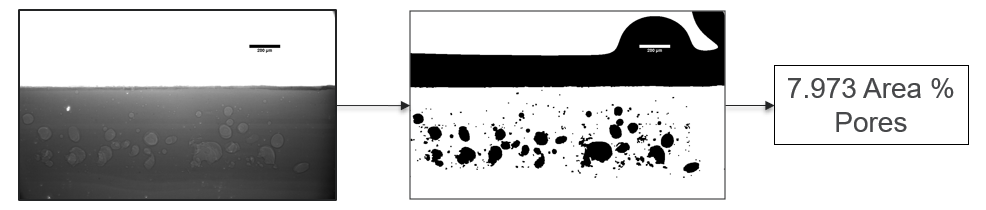
My research has focused on a specific type of defect called Keyhole porosity. This occurs when bubbles of gas get trapped underneath the surface a part constructed during the MAM process, resulting in the formation of relatively spherical pores under the surface of the part. This is opposed to other types of porosity, which can form from incomplete melting of the powder material or improper adhesion of two layers of material. An example of keyhole porosity after a print is shown in Figure 3. To compare the severity of keyhole porosity formation, I treated the area under the surface of the sample with imageJ, and measured the area faction which displayed keyhole porosity. Two examples of this process are shown in figures 4 and 5.
![]()
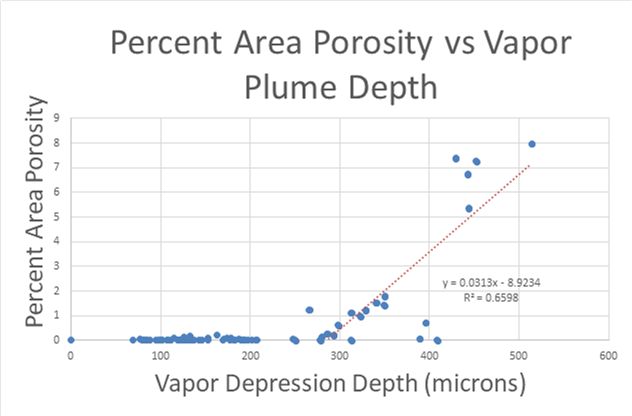
A large majority of my time on this project was spent demonstrating that some behaviors observed by others studying this issue were repeatable. In other studies, it was found that the primary physical characteristic which can be correlated with the formation of keyhole porosity is the geometry of the vapor depression. A vapor depression is a column of vapor that penetrates into the bulk of the part during the MAM process. An example is shown in Figure 6. When the width of the vapor depression is kept constant, the vapor depression depth becomes the primary driving factor for keyhole formation. The physical behavior occurring here is that the surrounding liquid metal will close around the bottom section of the vapor depression. This creates a bubble of vapor underneath the surface, which is often trapped underneath the surface when the surrounding material solidifies. In the case of Ti-6Al-4V, the relation is described in Figure 7. Below about 250 micrometers, there is little to no porosity formation. Above 250-300 microns, serious porosity formation starts to occur, increasing fairly strongly with the vapor depression depth, up until it reaches 5-8 % porosity in the 450-550 micron range.
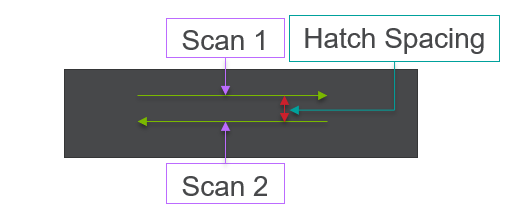
All of this previous data was obtained with single scan samples, in which a sample was scanned once with the laser used to simulate the MAM process. However, we also performed multiple tests in which the samples were scanned multiple times, with a slight offset distance between each scan line referred to as the hatch spacing. This work was done in order to study the effect of thermal history on the formation of porosity. An example of the process of scanning on direction, moving to be offset slightly, and then scanning back the other direction is pictures in Figures 9, and Figure 10 is a video showing this behavior in action using X-ray transmission on the top and IR on the bottom. This ends up being a better approximation of the actual MAM process. Constructing a part with MAM requires hundreds, if not thousands of scans, and it seemed pertinent to see how these behaviors changed from scan to scan. The results of this testing show a clear difference between the first and second scan, where the second scan displays a deeper vapor depression, and consequently displays an increased amount of keyhole formation. The data is shown in Figure 11.
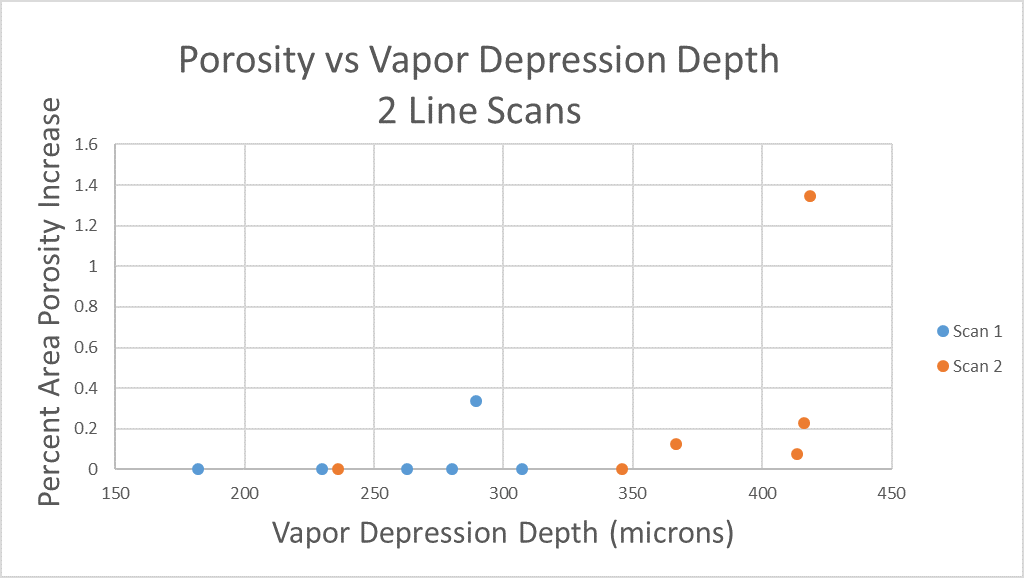
As can be seen, only 1 of the 6 samples display an increase in porosity after the first scan, but 4 of the 6 samples shown an increase in porosity after the second scan (Figure 11). Also, all but one of the scan 2’s have a greater vapor depression depth than the first scan, indicating that this increase in porosity formation is due to an increase in vapor depression depth (Figure 11). There is a statistical significant increase in the vapor depression depth, with the mean being a 107.6 micrometer increase in vapor plume depth, with a standard deviation of 16.4 micrometers, resulting in a 95% confidence interval of 74.9 microns to 140.3 microns.
Unfortunately, I have not been able to transform this information into anything useful for the purpose of detecting keyhole formation with IR. I have made several attempts at potential low hanging fruits, comparing profiles of temperature along the scan line as well as the spot size as seen in the IR camera to the vapor depression width and depth, but have achieved nothing of note at this point. There are still other methods which could be fairly simple to make an analysis out of, as well as much more sophisticated methods which could be used to attempt to find such a correlation. This will be one of the aims of future work.
Advancements in Desalination Technologies: Applications of Electrodeionization
Hello! My name is Caroline Kaden and I am a rising senior studying chemical engineering. This summer I was able to work in the Advanced Materials Division of Argonne National Laboratory, more specifically within the Water-Energy Nexus with Dr. YuPo Lin. Water plays a crucial role in energy and fuel production, from usage in power plant cooling towers, to fracking, to acting alone as a renewable source by hydroelectric power. Similarly, energy is needed to produce usable water from various sources. Pumping, desalinating and distributing water all require energy. Factors such as climate change, and regional variance including population, geography, weather, and occurrences of natural disasters all contribute to the importance of the Water-Energy Nexus because these factors can shift water and energy demands greatly and unexpectedly over short periods of time.
One of the most consumptive and least efficient processes is thermoelectric cooling. Focusing on the optimization of this could therefore greatly decrease water and energy use. More specifically, minimizing the energy used to desalinate water as well as having more usable water for cooling towers will make a large difference in the Water-Energy-Nexus because cooling towers account for almost 50% of interdependent water withdrawal within the US. The inefficiencies of cooling towers are that high mineral, contaminant, and salt content promote scaling therefore decreasing functionality, the blowdown water can be very difficult to treat or dispose of due to high salinity and contaminant content, and even with heavy monitoring, withdrawal of water for make-up usage is very large and increases the impact within the nexus.
However, Electrodeionization (EDI) technology can help solve these issues. EDI is a far more energy-efficient and economical pretreatment than previous water treatment solutions, which means blowdown frequency can be reduced. Sea water, brackish water, produced water and treated municipal effluents are all possible candidates for makeup water if treated sufficiently and economically, and reduce the amount of freshwater needed for makeup water in the cooling tower. These solutions are largely beneficial as developing and optimizing water reuse technologies can reduce cooling tower water consumption by up to 40%.
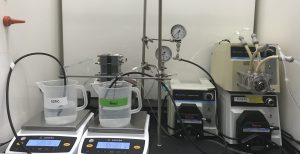
This summer I did research specifically working with removing silica from water. Silica is especially difficult to remove because it is almost always present in both the reactive and unreactive forms and it is nearly impossible to control which form is present. Additionally, the solubility is affected by time, pH, and temperature. The experiments I ran involved building an EDI stack, with resin wafers inside to promote ionic transport. I then pumped a silica solution through the system as a batch operation, taking the conductivity and pH of both the feed and concentrate regularly to analyze the concentration. The set up is shown below. The EDI stack is in the back left.
I found that silica does not move through the tower as easily as salt, as not all of the silica originally put into the system is accounted for in the feed nor the concentrate at the end of the experiment. I hypothesize that the the silica being adsorbed onto the resin beads. Because of this, the next steps to take include: changing components out, such as using different resins and/or different membranes to better promote silica transfer to concentrate stream, changing operating conditions such as flowrate, voltage applied, and running continuous feed of silica solution to test for a steady-state point of separation.
Overall this summer’s work was very rewarding and interesting as it combined my background in chemical engineering with my interest in sustainability and I look forward to seeing where EDI and separation technology lead to!
Characterizing Tagged Cytochrome P450 Enzymes
Hello, my name is Joseph Draut, I’m a rising senior at Northwestern University studying chemical engineering. This summer, I’ve been working on a collaboration between the Tullman-Ercek lab and the Tiede lab, investigating cytochrome P450, an enzyme capable of carrying out oxygenation reactions on inactivated carbon-hydrogen bonds – a reaction that is challenging to carry out with chemical catalysts. This chemistry is particularly useful in generating industrially valuable compounds like linear alcohols, amines, or steroids. Ultimately our project seeks to investigate functionalizing P450 through modifications that would make the protein more efficient. Since P450 is relatively unstable in the cytoplasm, selectively localizing the protein to a more amenable environment may improve protein functionality. Towards this end, the Tullman-Ercek lab has added a tag (a small amino acid sequence) that drives the localization of the protein to a microcompartment – a small protein “cage” so to speak. The addition of this localizing tag alters the amino acid sequence of the protein and could therefore potentially alter the functionality. Thus, my work this summer has aimed to determine whether tagging P450 alters its functionality compared to the wildtype (untagged).
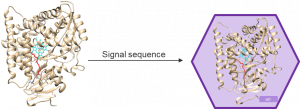
Figure 1. Cartoon depicting the localization of P450 to bacterial microcompartments after addition of a short localization sequence to the protein.
Throughout the summer, I have been able to optimize an expression strategy for P450 in E. coli and purifying using fast protein liquid chromatography (FPLC). I have further validated the activity of our tagged P450 on varied chain ethers and found it comparable to the wildtype. In the interest of using electron paramagnetic resonance (EPR) – a technique that interrogates unpaired electron systems – to further characterize our P450 variants, I quantified the robustness of P450 to freeze-thaw cycles, as EPR requires sample freezing. With these tasks done, I intend to carry out EPR based experiments in my remaining time at Argonne.
Coming from a cell-based devices background, this summer I wanted to learn about other domains of biology research and how synthetic biologists and biochemists can collaborate to apply diverse knowledge and experiences to further biological interrogation and application. I have gained a multitude of new skills and furthered my horizons in the research space, all of which I will carry with me in my future endeavors.
Mimicking Proteins: Heme and Copper Binding in Peptide Amphiphiles
Hello, my name is Ari Jacobson and I am a rising senior at Northwestern University studying in Integrated Science, Biomedical Engineering and Computer Science. This summer I am working with Dr. H. Christopher Fry under lead scientist Dr. Gary Wiederrecht in the Nanophotonics & Biofunctional Structures group at the Center for Nanoscale Materials at Argonne National Laboratory.
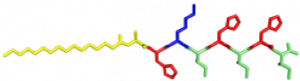
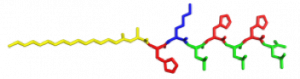
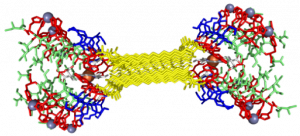
In the Nanophotonics & Biofunctional Structures group many of the projects seek to create functional nanomaterials that are inspired by functions in nature. One of the projects I worked on used peptide amphiphiles (PAs) to bind heme porphyrin and transition metals. This project gets its inspiration from nature, where there exist enzymes which bind heme and copper in order to complete electron transfer and that can exhibit catalytic properties. Our PAs are synthesized by solid phase peptide synthesis using an automated synthesizer. They consist of a peptide sequence capped with palmitic acid at the N-terminus of the . These PAs self-assemble in water, sometimes dependent on pH, and can form supramolecular structures including micelles, ribbons, fibers, and sheets. The peptide sequence at the end can be selected to be bioactive and exposed on the exterior of the nanostructures.
In my project, I compared two peptide sequences and used a variety of spectroscopy techniques to probe heme, copper, and nickel coordination with the amphiphiles. We used PAs with sequences C16-AHKIHIHI-CONH2 (IHIHI PA) and C16-AHKLHLHL-CONH2 (LHLHL PA). These are designed with a histidine towards the hydrophobic region in order to bury a bound heme molecule, and two histidines towards the hydrophilic region to bind copper, nickel, or potentially other transition metals. I hypothesized that using leucine instead of isoleucine in between the histidines would create a more flexible backbone which would increase the efficiency of binding, and binding both heme and a transition metal.
My findings suggested binding of both copper and heme for IHIHI PA. We confirmed heme binding with UV-vis spectroscopy, as we saw a peak at 425 nm when the sample was heated, as we were able to show an effect on the secondary structure of IHIHI PA when copper is added to the solution using circular dichroism (CD), a change in morphology via atomic force microscopy (AFM), and a change in the binding of heme after copper has been added via UV-Vis spectroscopy.
With our LHLHL PA, we were similarly able to show heme binding with heat, showing a peak in UV-Vis at 425 nm. We were not able to see a secondary structure change upon the addition of copper, but we were able to see a change in heme binding when copper was added first, as there was a blue shift in the spectra when more copper was added, eventually showing no heme binding when enough copper was added. This indicates that copper is interacting with our peptide.
From the data I collected this summer using a variety of spectroscopy techniques, we are able to see that copper interacts with both peptides. We are not, however, able to confirm that copper and heme are bound at the same time when heme is added first. In order to further understand this, electron paramagnetic resonance (EPR) spectroscopy must be performed. Once this binding is better understood, it will be possible to further optimize the system and characterize any catalytic or electron transfer capabilities this system may hold.
I am grateful for the opportunity that I had at Argonne National Lab this summer. I would like to recognize the work of Dr. Jennifer Dunn at Northwestern – Argonne institute of Science and Engineering and Dr. H. Christopher Fry at the Center for Nanoscale Materials for their work this summer in making this possible and mentoring me.
Using 3D Printing to produce sub-millimeter sized structures
Hi, my name is Anant Gururaj and I’m going to be a senior at Northwestern. This summer I’ve been working in the Applied Materials Division with Kaizhong Gao. I’m using 3D printing, specifically Finite Deposition Modelling, to develop a device intended to interact with particulate matter in liquid and gaseous streams. I’m not allowed to discuss specifics or show any prototypes I’ve developed, so I’ll be focusing on the two biggest challenges I’ve faced. These are minimizing printing time, especially for circular geometries, and achieving print thickness of less than 1mm.
I’m using Finite Deposition Modelling (FDM) to create our device. Other techniques are available but FDM is cheap and more widely used than others. Plastic (ABS) filament is fed to heated extruder where it melts. The extruder then deposits plastic onto the (heated) build plate layer-by layer to create a 3-D structure. Temperature of the extruder and plate, and print speed parameters can be controlled.
The design of the device calls for the construction of several rods, with each rod being designed to ensure the maximum surface area to volume ratio. I’m considering only rods with circular and square cross sections, and in either case, minimizing the diameter/side length of the circular/square rod results in maximizing the surface area to volume ratio.
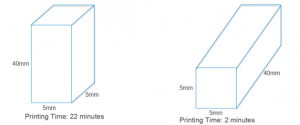
Orientation of the object on the build plate made a massive difference to the print time (below). With circular rods, however, after the first layer is printed, subsequent layers will have overhanging regions that will drip onto the build plate, so orienting circular rods horizontally (which cuts down printing time significantly) on the build plate is not an option, and I only looked at square rods going forward.
In terms of minimizing print thickness, the minimum thickness achievable was 0.5mm, due to the printer’s nozzle width being 0.5mm. In fact, the software used by the 3D printer refused to process any structures that had dimensions less than 0.5mm. So I tried printing a rod with a cross section with a 0.6mm side length, and upon measuring it found that its dimensions were 0.75mm x 0.44mm. This deformation is likely due to the ABS ‘sinking’ under its own weight, as it is not completely solid when released from the extruder.
The 0.75mm x 0.44mm rod I printed was a singular rod, so the next logical step was investigating whether I could recreate those dimensions with more complex arrangements of rods, which would be needed in creating the device. Unfortunately, I can’t show any pictures of the prototype I made, but I found that when arranged in more complex configurations, the rods that were printed had dimensions closer to the intended 0.6mm x 0.6mm, but there was still some deformation.
Going forward there are other 3D printing techniques, such as Stereolithography, that could be used to produce rods with smaller dimensions much more precisely. These methods are, however, more expensive. Smaller nozzles could also be used, but these can also be expensive.