Improving Dimensional Accuracy of Parts Created with Binder Jet Printing

Hello! My name is Zachary Martin, and I am an undergraduate Materials Science & Engineering student at Northwestern. This summer I am working with Dileep Singh in the field of additive manufacturing (AM), and my project focuses on minimizing/controlling dimensional distortions created during the sintering process of binder jet printing, a promising powder printing technique.
The binder jet printing process is capable of fabricating entire complex parts by repeatedly infiltrating layers of loose powder with a liquid binder, holding the targeted region of powder together until postprocessing, forming a “green part” that is later densified and bonded through sintering.
What sets binder jet printing apart from the many other AM technologies is that this first step of creating a “green part” involves only small temperature variations. Other techniques, including the heavily researched Selective Laser Melting (SLM), form final parts in the printing bed through the use of large inputs of energy to rapidly melt and bond each layer of powder together, which introduces a large temperature gradient across the surface of the part. These gradients lead to the development of internal stresses within the component, lowering the performance of the final part.
Binder jetting avoids these problems by creating a green part at a relatively constant temperature, before heating this entire component simultaneously during sintering to ensure the development of temperature gradients within a sample is minimized. Specifically, the sintering process of binder jet printing uses high temperatures to first remove the binder material, and then densify the powder into a final part. By densifying the part simultaneously, sintering promotes the creation of three-dimensional bonding, eliminating issues of anisotropy and yielding parts with bonding structures closer to those found in traditional manufacturing feedstock.
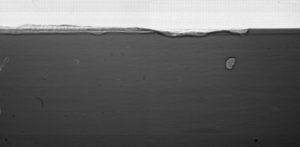
While able to significantly increase the mechanical performance of final parts, sintering conditions must be carefully controlled to promote the densification of a part, while minimizing the propagation of undesired creep and uneven shrinkage at high temperatures. The process requires parts to be heated to high temperatures for an extended period of time, allowing for the development of notable creep in final parts, which my project works to reduce. Additionally, temperature gradients within the furnace can lead to unequal rates of shrinkage across a part, leading to dimensional warpage. These dimensional distortions can be seen in final samples, demonstrated by the angled outside edges and disrupted channels in Figure 1 below.

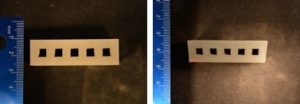
Figure 1: Dimensional changes to channeled green part before (left) and after (right) sintering
In previous studies, warpage of the final part has been counteracted by infiltrating parts with ceramics or other metals. One group reduced distortions by introducing ceramic nanoparticles to fill voids present in a steel powder crystal structure, which greatly blocked creep over the sintering process. Another group introduced additional metals with a lower melting temperature than the powder feedstock, which showed a similar reduction in creep. These solutions, however, alter the performance and properties of final parts, as the structures is no longer purely steel.
Throughout the course of my project, my research focuses on altering the temperature and time conditions of the sintering process to quantify their effects on the overall warpage of a final part. Additionally, by changing sample orientation during sintering, I can identify trends that minimize the effect of gravity and temperature gradients on a part. To systematically quantify the warpage present, I use a combination of ASTM dimensional guidelines and distortion measuring methods expressed in previous additive manufacturing papers. This allows samples to be empirically compared in respect to warpage in each dimension. The guidelines I use are visualized below in Figure 2.

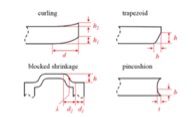
Figure 2: Classification of warpage and dimensions measured in a final part
Going forward, the group will move onto the creation of channeled parts using a ceramic material, which must be created using binder jet printing since the high temperatures required bond the powder cannot be achieved using SLM or other laser-based techniques. The results from my research will reveal optimal processing conditions to minimize creep and temperature gradients during the sintering process, and will provide a basis for which to quantify the results of the final ceramic part.


References
[1] S. Allen, E. Sachs, “Three-Dimensional Printing of Metal Parts for Tooling and Other Applications”, METALS AND MATERIALS, vol. 6, no. 6, pp. 589-594, 2000.
[2] L Grant, M. Alameen, J. Carazzone, C. Higgs, Z. Cordero, “Mitigating Distortion During Sintering of Binder Jet Printed Ceramics”, Solid Freeform Fabrication Symposium, 2018.

Predicting and Responding to Microclimatic Changes in an Electronics Enclosure

Hello! My name is Richard Yeh, and I am a rising senior with majors in Electrical Engineering and Integrated Science Program at Northwestern. This summer, I am working with Pete Beckman and Rajesh Sankaran on improving the resiliency of the Array of Things (AoT) nodes. The AoT nodes that are deployed have to be outdoors throughout the year, experiencing the full force of nature through night and day and rain or sun. Despite this, the sensors have to be reliable and resilient to maximize uptime and minimize maintenance, especially as the scale of the project increases and more nodes get deployed over a larger range of area. When looking at nodes that have been brought back from deployment over the years, it has been observed that the electronics inside are prone to failure, which is expected given the harsh environment they are exposed to. My work here is to develop a method to predict and anticipate weather events that could negatively impact the performance of the nodes so that preventive action can be taken.
The first step was to ensure that accurate data is being collected to better understand the environment inside and surrounding the nodes. This involves identifying historically problematic sensors and fixing the pipeline through which their data is sent. Many of the sensors used by the AoT nodes run on a communication bus using the I2C protocol which is able to interface with dozens of sensors through just two wires. Previously, it was noted that many of the sensors running this protocol often report erroneous values, publishing inaccurate results that were being made public. Additionally, by nature of the way the I2C protocol works, when one sensor on the bus malfunctions, there is a chance for the entire bus to go down, rendering other sensors nonfunctional. My first project was to resolve this issue by updating the firmware on the sensor boards to be able to run a check on the I2C bus and react accordingly. The changes allow for a scan to be run on the bus to detect and identify these failing sensors and “disable” them, preventing data from being published from those specific sensors even when requested from.
Having updated the firmware on several deployed nodes, the next step was to determine the types of failures that can occur. For electronics in enclosures that are exposed to a variety of external climatic conditions, one major concern is humidity build up and condensation, which is problematic for the longevity of these electronics as the presence of water leads to significantly higher rates of corrosion.

Figure 1: Sensor Board from Previously Deployed Node. White discolorations indicate corrosion

In studies of simulated cycling temperature conditions to a typical electronic enclosure, accumulation of water content in the enclosure has been observed over each cycle, increasing the absolute humidity over time [1]. Additionally, the problem is compounded on by possible contamination on the sensor boards from the manufacturing process. Contamination in the form of ionic residues on the boards can lead to leakage current and corrosion at lower humidity levels as the salts begin to absorb moisture and form conduction paths [2].
To get an idea of when and why corrosion happens on the boards, it is important to see what the climate profile looks like inside the nodes. By using temperature and humidity measurements from sensors inside of the enclosure housing the electronics, the internal microclimate can be observed and analyzed:

Figure 2: Plot of Internal and External Temperature, Relative Humidity, and Absolute Humidity Over 7 Days for 1 Node

It is suspected that condensation may be happening where there are sudden drops in internal absolute humidity, indicating a loss of water content. However, continued analysis over a longer range of time and over a larger range of nodes is still being done to correctly identify the cause of the sensor readings, such as other factors like rain events.
Eventually, the goal is to extend this kind of real time analysis and detection to other potentially damaging cases, such as conditions that promote corrosion or extreme temperature. Once a node senses that the environment is reaching the threshold that would result in one of these damaging scenarios, the node can then employ emergency self-protecting procedures, such as generating heat using the CPU onboard in cold temperatures, or shutting down parts of the board that could be at risk because of condensation. All of this helps to keep these nodes alive for a longer period of time, collecting and publishing accurate data.
 
References
[1] H. Conseil, V. C. Gudla, M. S. Jellesen, R. Ambat, “Humidity Build-Up in a Typical Electronic Enclosure Exposed to Cycling Conditions and Effect on Corrosion Reliability”, Components Packaging and Manufacturing Technology IEEE Transactions on, vol. 6, no. 9, pp. 1379-1388, 2016.
[2] V. Verdingovas, M. S. Jellesen, and R. Ambat, “Impact of NaCl contamination and climatic conditions on the reliability of printed circuit board assemblies,” IEEE Trans. Device Mater. Rel., vol. 14, no. 1, pp. 42–51, Mar. 2014.

Computer Vision for the Optimization of Laser Powder Bed Fusion Analysis

Hello there! My name is Lyon Zhang, and I am a rising junior studying Computer Science at Northwestern. This summer I am working with Jakob Elias on a variety of projects with a broad goal of using networking and artificial intelligence techniques to automate visual analysis of varying manufacturing methods. The most extensive and ambitious of these is Laser Powder Bed Fusion, a 3D printing technique using a thin layer of metallic powder.
As a short summary, Laser Powder Bed Fusion (LPBF) is an additive manufacturing technique that uses a laser beam to melt a thin layer of metallic powders through to the base below. This method is tremendously useful, similar to other 3D printing techniques, because of its ability to facilitate the automated production of geometrically complex and minuscule parts. However, the high energy of the laser, scattered nature of the powder bed, and dynamic heating and cooling patterns result in a chaotic process that easily form defects in defect-sensitive components. For a more detailed overview of LPBF, see Erkin Oto’s post below.
The current method of analyzing defects (specifically, keyhole porosity as explained by Erkin) is simple manual inspection of X-Ray images. Once deformities have been spotted, a researcher must personally sync the X-Ray frame up with its corresponding infrared data. Like any analytical process that involves human judgment, this method is time consuming and somewhat prone to errors, even for the best researchers.
Thus, the first step was to create a tool that could assist with immediate research needs, by providing fast, locally stored data, synced images with informational charts, and dynamic control over the area of interest:

Figure 1: Demo interface with fast data pulling and pixel-precise control

One flaw with the above interface is that the infrared values do not inherently contain accurate temperature values, and thus these must be computed manually. In the interface, we are using a pre-set scale that is not necessarily accurate, but is still useful for visualization. However, for precise research on LPBF, exact temperature data is needed to gauge the physical properties of the materials used.
Once again, the process of calibrating exact temperature values is currently done by visual identification of the melt pool in X-ray images combined with knowledge of material melting point. This method is thus entirely subject to the researcher’s intuition:

Figure 2: X-ray video of powder bed during fusion. The chaotic heating, cooling, and pressure differentials cause distortion and volatile powder particles.

The disorderly nature of the LBPF process lends itself to a consistency problem – one researcher may have different opinions from another on the correct location of the melt pool in any given experiment. Even the same researcher’s intuition certainly suffers minor variations from day to day. To this end, any sort of automation of this visual identification problem would immediately provide the benefit of consistency from experiment to experiment.
The automated visual identification of these image sets takes advantage of the different textures and brightness levels of each region, and incorporates these with assumptions about the location of the melt pool relative to said regions. An experimentally discovered sequence of brightness thresholding, Gaussian blurring, median blurring, brightening, and Canny edge detection culminate in semi-accurate region detection for individual images:

Figure 3: Process of region detection for individual images.

This process is quick (approx. 1.5 seconds for all ~100 images), and accurate at first glance. However, putting all the processed images together in sequence reveals that the detected bottom of the melt pool is actually quite chaotic. Fortunately, this has a relatively simple solution, which takes advantage of high image count in order to generate a smoothed path using mean squared error regression. With ~100 images contributing, this estimation (with a researcher inputted offset) is almost guaranteed to accurately emulate the true path of the laser.

Figure 4: (Top) True detected location of melt pool bottom (red) and smoothed estimate of laser path (blue). True pixel values of detected bottom location and the least mean squared error line that returns rate of movement (bottom).

From there, it’s a relatively simple process to match the points demarcating the melt pool on the X-ray image to the corresponding points on the IR images, using the known geometry of the images:

Figure 5: Melt pool bounds on X-ray image (right) and corresponding area on the IR images (left).

While already useful in providing consistency, speed, and accuracy in melt pool detection for LPBF, the process still contains steps that require manual input and should be automated in the future. For example, the existing sequence of image processing techniques used to detect the melt pool was iteratively developed simply by entering successive combinations into the processing script. Many experiments are conducted with the same X-ray camera settings and thus should use the same image processing techniques. If a researcher could label the correct laser positions on just a few image sets, it would be trivial for a machine learning model to discover the best combination for use on many following experiments.
Another crucial issue is that although many experiments are run with the same camera settings, not all are. Thus, given different image sets, the optimal image processing parameters might need modifications on a non-trivial timescale. Another potential avenue for future development would be to create a classifier that could determine the image type based on image features, and then select the correct set of processing parameters as determined using the method above.
These two further developments alone could turn this project into a useful tool for the visual analysis of all LBPF experiments, not limited by trivialities such as researcher bias and X-ray imaging settings. Once integrated with other LBPF analysis research performed this summer, this computer vision project has the potential to help form the basis for a powerful tool in LBPF defect detection and control.
References:

  1. Zhao C. et al. “Real-time monitoring of laser powder bed fusion process using high-speed X-ray imaging and diffraction.” Nature Research Journal, vol. 7, no. 3602, 15 June 2017
  2. Jinbo Wu, Zhouping Yin, and Youlun Xiong “The Fast Multilevel Fuzzy Edge Detection of Blurry Images.” IEEE Signal Processing Letters, Vol. 14, No. 5, May 2007

In Situ Analysis of Laser Powder Bed Fusion Using Simultaneous High-speed Infra-red and X-ray Imaging

Hello! My name is Erkin Oto, and I am a master`s student in Mechanical Engineering at Northwestern. I am working with Aaron Greco and Benjamin Gould on the In Situ Analysis of Laser Powder Bed Fusion Using Simultaneous High-speed Infra-red and X-ray Imaging project.
Laser powder bed fusion process is a type of additive manufacturing (AM) that selectively melt or bind particles in thin layers of powder materials to build 3D metal parts. However, the consistency of parts manufactured by this technique is still a problem, and overcoming this problem requires the understanding of multiple complex physical phenomena which occur simultaneously during the process.
Because the components are fabricated layer by layer, LPBF allows for the manufacture of geometrically complex parts that are not possible to manufacture with traditional manufacturing techniques. It also has the capability to make complex parts with significantly less wasted material than the other traditional manufacturing processes. However, the use of a high power laser beam leads to high temperatures, rapid heating/cooling, and significant temperature gradients resulting in highly dynamic physical phenomena that can form defects in the parts.
If the build parameters, including laser spot size, power, scan speed, and scan path, are not controlled, then the microstructure of the final product could contain unwanted porosity, cracks, residual stress, or an unwanted grain structure. It is essential that advanced in situ techniques, particularly those that can correlate material thermal conditions (i.e. heating and cooling rates, and thermal gradients) to build parameters, are required to be able to solve the unknowns of the process.
Although high-speed X-ray imaging provides great insight into the important sub-surface features that determine the quality of the LPBF process, it is unable to directly convey the quantitative thermal information that is necessary to fully understand the LPBF process.
Also, every industrial machine has some sort of IR camera attached to it. Therefore, if behaviors and defects seen in X-ray can be linked with IR videos, then the IR camera can be used within a control system to prevent defect formation.
The current project I am working on combines the high-speed infra-red (IR) imaging and hard X-ray imaging at the Advanced Photon Source (APS) at Argonne, to provide an analysis that correlates IR and X-ray images to be able to understand and quantify dynamic phenomena involved in LPBF. My work consists of observing the formation of multiple points of subsurface porosity, commonly referred to as keyhole pores. In specific, I am focusing on understanding the keyhole porosity formation at the end of each track which is referred to as the “end track keyhole porosity”. This phenomenon is especially of interest since under the same laser and material conditions, the end track porosity is not always observed. I am trying to shed light on the phenomena that are causing the random formation of these end track keyhole pores.

Figure 1: End track keyhole porosity formation
It was determined by my research group that there are large differences in the temperature history of the probed pixels when the experiments with and without the end track keyhole porosities are compared. It was also determined that a larger maximum cooling rate and a higher temperature after solidification was observed.
Therefore, I start by selecting a certain region of interest or the exact pixel on the IR images at the instant the end track keyhole porosity is observed on the X-ray image. This requires syncing the IR and X-ray images. After finding the right pixel, I look at the cooling rate of that specific pixel and compare it with the cooling rate of a pixel taken from an experiment done under same conditions and has not formed an end track porosity. The cooling rate comparison for the keyhole porosity formation is given below.
              porosity formed                                                          no porosity
Figure 2: Cooling rate comparison for two builds, one forming an end of track porosity
The main advantage of this study is that combining the X-ray and IR imaging makes it possible to identify the thermal signatures that cause the formation of defects. This could further be developed by adding a control system in commercial printers that can identify defects in situ by tracking the thermal signatures of the build. The cost of the additive manufacturing processes could be cut significantly by determining a defect early in the process, so that the companies would not dedicate all the time and money later to find out that the built part is unusable after all.
 
References:

  1. Parab. et al. “Ultrafast X-ray imaging of laser-metal additive manufacturing processes.” Journal of Synchrotron Radiation, vol. 25, 2018, pp. 1467-1477.
  2. Cunningham. et al “Keyhole threshold and morphology in laser melting revealed by ultrahigh-speed x-ray imaging.” Science Mag, vol. 363, no. 6429, 22 Feb 2019, pp. 849-852.
  3. Zhao C. et al. “Real-time monitoring of laser powder bed fusion process using high-speed X-ray imaging and diffraction.” Nature Research Journal, vol. 7, no. 3602, 15 June 2017

Using Time Series Techniques to Understand the Correlation between Light, Thermal Radiation, and Reported Temperature Error

Hello! My name is Kevin Mendoza Tudares, and I am a rising sophomore at Northwestern University studying Computer Science. This summer, I am working with Pete Beckman and Rajesh Sankaran on developing a process to clean and organize preexisting and incoming data from the Array of Things (AoT) nodes as well as use time series techniques on this data to quantify the correlation between direct exposure to sunlight and the resulting error in the reported environmental temperature (and humidity) by the node.
Having an up-to-date server and database is critical when working with live and time-series data, and at the moment, the research team is transitioning their database system to using PostgreSQL extended with TimescaleDB in order to efficiently manage the incoming data from the nodes as time-series data. That is why a part of what I am working on this summer is writing scripts/programs that will cleanly create mappings and upload data representing the system of nodes and sensors in the form of .csv files into their appropriate relational tables in the new database. These scripts will also transfer other preexisting node and sensor data along with large amounts of measurement data from the previous database system into the new one. This first part of my work is important for the execution of the second portion as I will be working with this same data to find correlations between the reported solar exposure and error in reported temperature.
The second task I will be working on involves knowledge of thermal radiation and how it affects the performance of outdoor temperature instruments, such as those used in climatology stations and found usually in white plastic housings or enclosures called Stevenson screens. These enclosures protect the instruments from precipitation and direct or reflected sunlight while still allowing air to circulate through them, thus allowing more accurate and undisturbed measurements from the environment around them. AoT nodes are built in a similar fashion for the same benefits, as seen in the figures below.

Figure 1: An AoT Node  

      Figure 2:  Exterior of a Stevenson screen

Along with the benefits of protection from this design, one of the issues with this for the AoT node enclosure is the concept of solar gain, which is the increase in thermal energy, or heat, in a space or object as it absorbs solar radiation. While the node casing protects the temperature sensors from direct incident radiation, as none of it is transmitted directly through the material and most of the radiation is reflected, there is still the presence of thermal reradiation from the protective material. This is because “despite being coloured white the external surfaces may be free to absorb some short-wave radiation, and some of this may reradiate internally” into the node as long-wave radiation and onto the temperature sensors (Burton 160). This infrared radiation causing the error doesn’t need to come from the sun directly, as it could also come from the glare from glass of a nearby building or from the hood of a passing vehicle, but this error is most often to occur in the day time when the sun is out and shining directly on these nodes. Another issue that goes in hand with the thermal reradiation would be the size of these nodes, as previous research has found that an overheating of air temperature inside smaller sized Stevenson screens was detected more frequently in comparison to much larger Stevenson screens, and these findings could be applied to the small-scale nodes mounted on poles (Buisan et al. 4415). Excessive solar gain can lead to overheating within a space, and with less space, this form of passive heating is much more effective as the heat cannot disperse. Finally, one last issue with the internal temperature of the nodes is the lack of active ventilation. Studies have found that Stevenson screens that are non-aspirated (no ducts) reported significantly warmer internal temperatures than ones with aspiration ducts under low wind conditions (Hoover and Yao 2699). Without aspiration ducts, which all nodes lack, the cooling for these nodes to maintain them at ambient temperature is limited to only wind conditions that will circulate air through the node.
Thus, with the knowledge of potential issues with the nodes that could result in errors in ambient temperature data, my task is to find, understand, and quantify the described trend. This process will involve the time-series data I previously cleaned and uploaded, querying the detected visible and infrared light measurement data from a node at times where the calculated temperature error reaches a certain magnitude, and using these associated values to create a model. This model can then be applied to estimate a more accurate measurement of the ambient temperature around the node by accounting for this error at other times given the light measurements.
My work on this project is important because working with accurate data and readings is essential for all other data analysis and machine learning tasks that must be done by the team to identify and predict phenomena in our environment. For this to be done, we must have faith in the data and any trends we see, and I am contributing to help understand these trends and account for them. Special thanks to Pete Beckman, Rajesh Sankaran, and Jennifer Dunn for mentoring me this summer.
 
References:
Buisan, Samuel T., et al. “Impact of Two Different Sized Stevenson Screens on Air Temperature Measurements.” International Journal of Climatology, vol. 35, no. 14, 2015, pp. 4408–4416., doi:10.1002/joc.4287.
Burton, Bernard. “Stevenson Screen Temperatures – an Investigation.” Weather, vol. 69, no. 6, 27 June 2014, pp. 156–160., doi:10.1002/wea.2166.
Hoover, J., and L. Yao. “Aspirated and Non-Aspirated Automatic Weather Station Stevenson Screen Intercomparison.” International Journal of Climatology, vol. 38, no. 6, 9 Mar. 2018, pp. 2686–2700., doi:10.1002/joc.5453.