Hello, my name is Vrishank and I’m a materials science and engineering major working on Flame Spray Pyrolysis this summer under Joe Libera, Nikola Ferrier and Jakob Elias, along with Ignacio Gonzales who worked with coding. Flame Spray Pyrolysis is a method of producing nanopowders by burning specific precursor solutions in a continuous flame. While the method holds promise for the scalable and continuous production of nanoparticles, it is possible to optimize the conditions for production in order to fine tune the final products.
The search for sustainable and scalable nanopowder production is of the utmost important in the face of the global energy crisis. Their high surface area-to-volume ratio is the key to optimizing industry processes where FSP products such as LLZO and TEOS find use as catalysts and electrolytes. One advantage of FSP is that it allows for the fine tuning of nanoparticle morphologies and will allow for Argonne to benchmark industry procedures for different compounds and properties.
This summer I worked closely with Joe Libera, understanding the process, trimming data using the in-lab data view program and analyzing the optical emission spectroscopy and Scanning Mobility Particle Sizer data. The main obstacle we encountered was the little resource and literature we had on the correlations between the optical emission spectrum and the product and thus decided the best route for us to go was to develop analytical tools to help deconstruct the FSP OES data.
-Vrishank Menon
I’m Ignacio Gonzales, rising junior who is majoring in a Mechanical Engineering and Manufacturing and Design Engineering. Over the summer I worked, analysing data at the Flame Spray Pyrolysis (FSP) project under Jakob Elias. The FSP is a new method of production of nanomaterials that Joe Libera has been developing at the Argonne National Laboratory. The benefits of this method is that it will enable a continuous production of nanomaterials (as opposed to bulk production) and it will costs less than current methods of production. Currently the FSP is able to produce nanomaterials, however these materials are raw; their shape, size and agglomerate structure are not controlled. The project consists in optimizing the conditions, of the FSP in order to be able to produce a final product with full control of the outcome.
I was assigned to the computational side of this project along with David MacCumber. Joe Libera and his team, had been conducting various tests with the FSP using various concentrations both LLZO and TEOS particles. From this Trials, there was a lot of data to work with, including Optical Emission Spectroscopy (OES) and Scanning Mobility Particle Sizer (SMPS) data. I mainly worked on deconstructing the OES data in order to obtain, specific features such as peak, height, width, area, equations for each broadband, etc. To achieve this, I worked closely with Vrishank Menon, and intern in the experimental side, he acted as a bridge between the experimental and computational side of this project and helped us understand the relevance of the data . Additionally I used various toolkits and packages in Python, such as RamPy and SciPy to perform a more accurate analysis . On the future, features will be used to create a Neural Net and for a Machine Learning platform in which using additional data such as a APS X-ray analysis on the nanomaterial, we can predict the properties of the nanomaterial produced.
-Ignacio Gonzales
Bioprocessing for Additive Manufacturing
Hello, my name is Patricia Lohman and I am a rising sophmore studying material science and engineering at Northwestern University. I work under Meltem Urgun-Demirtas and Patty Campbell on in a bioprocess and reactive separations group. This summer I was tasked with bioprocessing for additive manufacturing or making 3D printable pastes made of food waste.
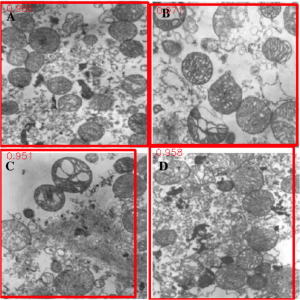
For much of the summer performed literature searches to compile a list of procedures for making biofilms out of different food waste. This included food waste with three different types of base materials. Vegetable and fruit waste (peels, shells, and seeds) made of cellulose, egg shells made of calcium carbonate, and shrimp shells from which chitosan could be extracted from. After the search, I worked in lab recreating the biopolymers found in the studies. I started with fruit and vegetable waste materials. To do so the process involved digesting dried plant waste material in dilute acid and casting the resulting mixture. In particular, spinach waste produced a flexible film.
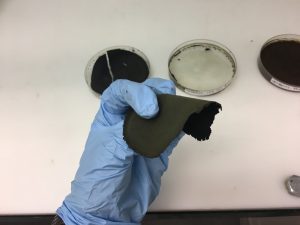
Figure 1: Spinach waste biofilm
The egg shell biomaterials began with dried and fine egg shell powder and was mixed with a binder solution until a clay-like paste was produced. The clay could be molded easily and held its shape.
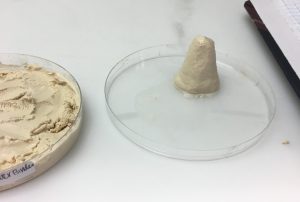
Figure 2: Egg shell paste
The above egg shell paste used less than 90 µm egg shell powder and sucrose water in a 1:1 ratio as a binder.
Shrimp shells do not have chitosan directly available. The shells once demineralized and deproteinized start with chitin. Chitin then undergoes a deacetylation reaction with concentrated NaOH at high temperatures to remove the acetyl group and convert chitin into chitosan.
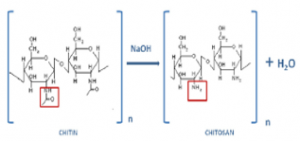
Figure 3: Chitin to chitosan deacetylation
The effectiveness of the reaction is key in determining the crystallinity, hydrophilicity, degradation, and mechanical properties of chitosan biomaterials. The target was to produce chitosan with a degree of deacetylation of 60% or greater. In lab I began working with pure purchased chitin and performing the deacetylation process under different conditions and measuring the degree of deacetylation. I plan to work on changing the concentration of NaOH, temperature, and conducting the reaction in an inert atmosphere to achieve that degree of deacetylation. After isolation, chitosan can be added to a number of organic solvents to form an extrudable paste.
Once the biopolymers were replicated, I planned on manipulating process parameters to achieve a consistency of paste that could be extruded by the Discov3ry extruder attachment, made especially for pastes, with an Ultimaker 3D printer.
Making bioplastics out of waste material is not only a novel idea, its an essential one. Food and plastic waste are glaring problems that have vast detrimental consequences on the planet. Finding alternatives to the materials used everyday is a good first step to tackling the issue. This project does a great job of addressing waste issues and providing exciting advances for additive manufacturing. I am very grateful that I was able to work on an impactful project and am excited to see where it goes. A special thank you to my PI’s and Dr. Jennifer Dunn for all their help this summer.
An Automated Workflow to Pre-process Images for Machine Learning Models
Hello! My name is Sarah O’Brien and I’m a rising Junior and Computer Science major at Northwestern University. I’m working with Maria Chan at Argonne and Eric Schwenker (PhD candidate in Materials Science and Engineering) at Northwestern on developing an automated process to create large training sets for image-based machine learning models.
Having large datasets with labeled classes or features is vital for training deep neural networks – and large datasets, particularly in the field of materials science, are often not publicly available. As such, without an automated workflow, organizing and labeling large sets of images is extremely time consuming and needs to be done manually each time we have a new problem to solve with machine learning.
This summer, we developed an Image Pre-processing Workflow to produce training and test data for our machine learning model. We first obtain many figures and captions from the scientific literature and use string parsing in the caption to decide if a figure is “compound,” i.e. made up of multiple subfigures. If it is, we extract each individual sub-figure with a figure separation tool developed by researchers at Indiana University2. Below is an example of the compound figure separation process.
TOP: Original Compound Figure from literature1; BOTTOM: Output of Figure Separation tool
Once we have a set of many separated figures, we decide if each is useful for our training set or not; for example, to create a set of microscopy images we trained a Convolutional Neural Network to create a binary microscopy image/non-microscopy image classifier. We trained this classifier on 960 total hand-labeled images (480 microscopy images and 480 non-microscopy images) and used two approaches: transfer learning and training from scratch. Both methods yielded classifiers with about 94% accuracy using ten-fold cross validation; we are working on making this classifier even more accurate by fine-tuning the models. Together with the figure separator, this trained classifier now allows us access to a large number of individual microscopy images for our future work on training a deep learning model.
My work on this project is important because a working image pre-processing workflow is essential for training a machine learning model. The data pre-processing stage of a machine learning task is often quite time consuming, so to be able to complete the stage automatically will offer us the ability to extract a large amount of information from a collection of images in a relatively short time, and therefore enable automated interpretation and understanding of materials through microscopy.
I’m excited for the future of this project and to see this workflow’s output in action building deep learning tools that will advance scientific collaboration. Special thanks to Dr. Maria Chan, Dr. Jennifer Dunn, and Eric Schwenker for mentoring me this summer.
References:
1: https://media.springernature.com/lw785/springer-static/image/art%3A10.1186%2F2047-9158-1-16/MediaObjects/40035_2012_Article_15_Fig2_HTML.jpg
2: S. Tsutsui, D. Crandall, “A Data Driven Approach for Compound Figure Separation Using Convolutional Neural Networks”, ICDAR, 2017.
Keyhole Porosity Formation in Metal Addative Manufacturing
My name is Jacob Hechter, I am a rising Junior at Northwestern University working on a degree in Materials Science and Engineering. This summer I’ve been working with Argonne’s Materials for Harsh Conditions group under Dr. Aaron Greco and Dr. Benjamin Gould on their Metal Additive Manufacturing (MAM) project. Colloquially known as metal 3D printing, MAM is the process of continuously adding material to a part during manufacture until the part has the desired final shape. This is in contrast to more traditional methods of manufacture, such as milling or grinding, which can be referred to as subtractive manufacturing.
This project focused on a type of MAM often referred to as Selective Laser Melting (SLM) Powder Bed Fusion (PBF). This process uses a Computer-Aided Design (CAD) document as a source for the design, where the CAD document is sectioned into a series of layers. The MAM machine deposits a layer of powder on top of a substrate and scans a laser across this layer of powder, to fuse the powder in the shape described by the bottommost layer of the CAD drawing. This process is repeated, up until the last layer in the CAD drawing has been completed. After this process has been completed, you are left with a part that has literally been built from the ground up.
MAM has several advantages over more traditional methods of manufacture. It allows for the construction of parts with much greater complexity than traditional manufacturing methods, allowing for the formation of internal voids and other such characteristics without the requirement to make multiple pieces which must be welded together. It can make complex parts with significantly less wasted material compared to traditional methods of manufacture. It also requires significantly less infrastructure to perform the manufacturing process, since it does not require an entire assembly line which must be retooled every time a adjustment is made to a design or a new part needs to be made. However, MAM has some other quite significant disadvantages when compared to traditional methods of manufacturing. During the MAM process, the material of the part undergoes complex thermal cycling, where it is rapidly heated and cooled by repeated scans within the space of seconds. This results in unexpected microstructures, and the formations of several characteristic defects which can ruin a part. This requires constant individual validation of every single part made via MAM if said part is going to be used in almost any application, making MAM produced parts significantly more expensive.

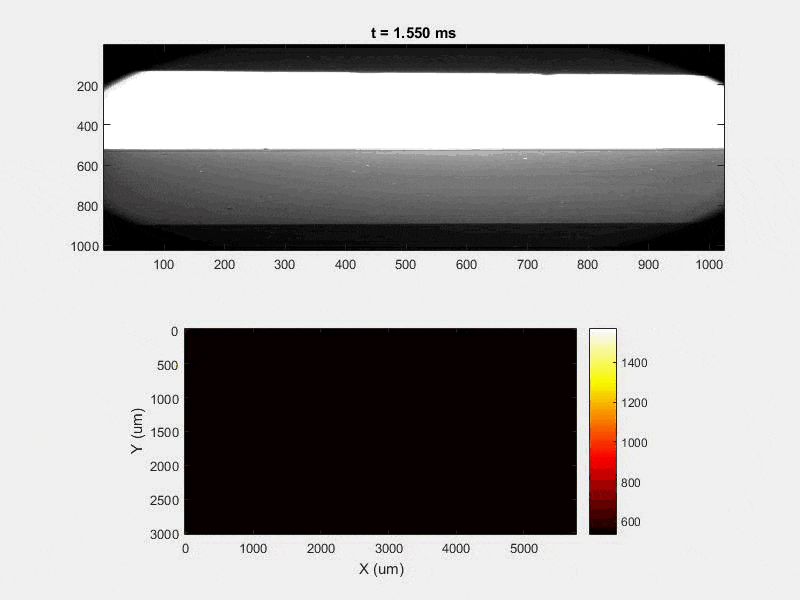
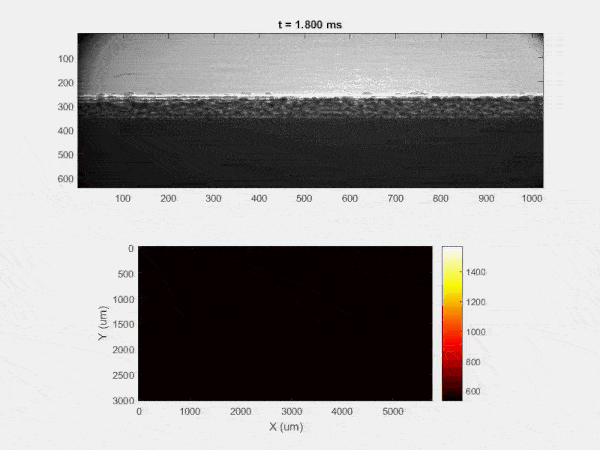
The overall focus of this project is to record in-situ X-ray transmission and IR videos of the MAM process, in an attempt to better understand its behavior and provide tools which can be used to avoid defect formation. The X-ray transmission analysis results in very high spatial and temporal resolution videos, allowing us to record data at hundreds of thousands of frames per second and pixels which are less than 2 microns wide. These videos give a fairly good picture of what is happening physically to the sample during the MAM process, and an example of one of these videos is shown in Figure 1. However, the only reason why we have these sorts of X-ray videos are because of our use of the Advanced Proton Source, and these videos can only really be obtained with relatively thin samples, so it is highly impractical to suggest these X-ray videos as a source of diagnostic of feedback for MAM. On the other hand, pretty much every industrial machine has some sort of IR camera attached to it. If behaviors and defects seen in X-ray can be linked patterns in IR videos (example in Figure 2) then it may be possible to use the IR cameras as a diagnostic tool, giving MAM machines feedback during the process to avoid defect formation and reducing the need for exhaustive validation.
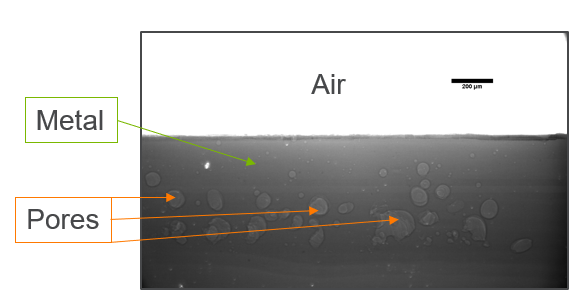
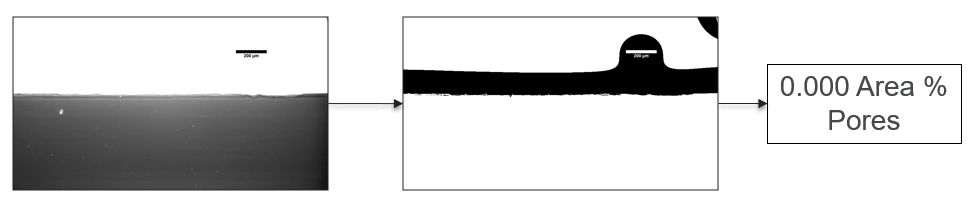
My research has focused on a specific type of defect called Keyhole porosity. This occurs when bubbles of gas get trapped underneath the surface a part constructed during the MAM process, resulting in the formation of relatively spherical pores under the surface of the part. This is opposed to other types of porosity, which can form from incomplete melting of the powder material or improper adhesion of two layers of material. An example of keyhole porosity after a print is shown in Figure 3. To compare the severity of keyhole porosity formation, I treated the area under the surface of the sample with imageJ, and measured the area faction which displayed keyhole porosity. Two examples of this process are shown in figures 4 and 5.
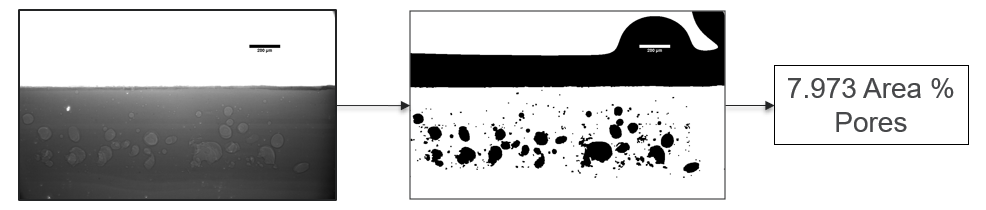
![]()
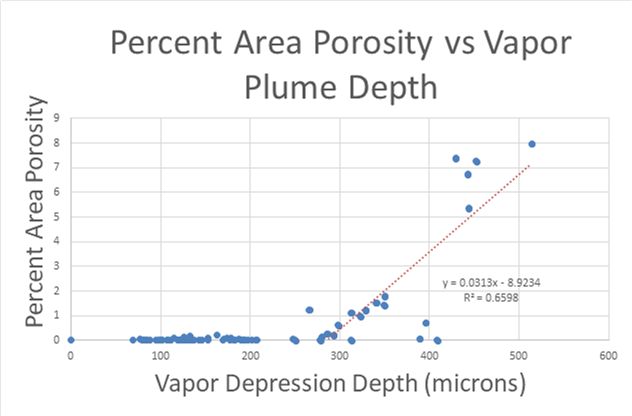
A large majority of my time on this project was spent demonstrating that some behaviors observed by others studying this issue were repeatable. In other studies, it was found that the primary physical characteristic which can be correlated with the formation of keyhole porosity is the geometry of the vapor depression. A vapor depression is a column of vapor that penetrates into the bulk of the part during the MAM process. An example is shown in Figure 6. When the width of the vapor depression is kept constant, the vapor depression depth becomes the primary driving factor for keyhole formation. The physical behavior occurring here is that the surrounding liquid metal will close around the bottom section of the vapor depression. This creates a bubble of vapor underneath the surface, which is often trapped underneath the surface when the surrounding material solidifies. In the case of Ti-6Al-4V, the relation is described in Figure 7. Below about 250 micrometers, there is little to no porosity formation. Above 250-300 microns, serious porosity formation starts to occur, increasing fairly strongly with the vapor depression depth, up until it reaches 5-8 % porosity in the 450-550 micron range.
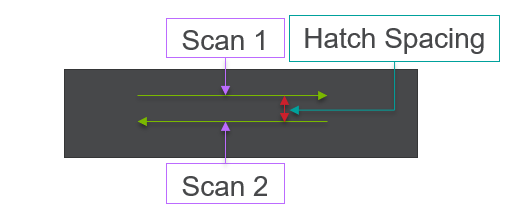
All of this previous data was obtained with single scan samples, in which a sample was scanned once with the laser used to simulate the MAM process. However, we also performed multiple tests in which the samples were scanned multiple times, with a slight offset distance between each scan line referred to as the hatch spacing. This work was done in order to study the effect of thermal history on the formation of porosity. An example of the process of scanning on direction, moving to be offset slightly, and then scanning back the other direction is pictures in Figures 9, and Figure 10 is a video showing this behavior in action using X-ray transmission on the top and IR on the bottom. This ends up being a better approximation of the actual MAM process. Constructing a part with MAM requires hundreds, if not thousands of scans, and it seemed pertinent to see how these behaviors changed from scan to scan. The results of this testing show a clear difference between the first and second scan, where the second scan displays a deeper vapor depression, and consequently displays an increased amount of keyhole formation. The data is shown in Figure 11.
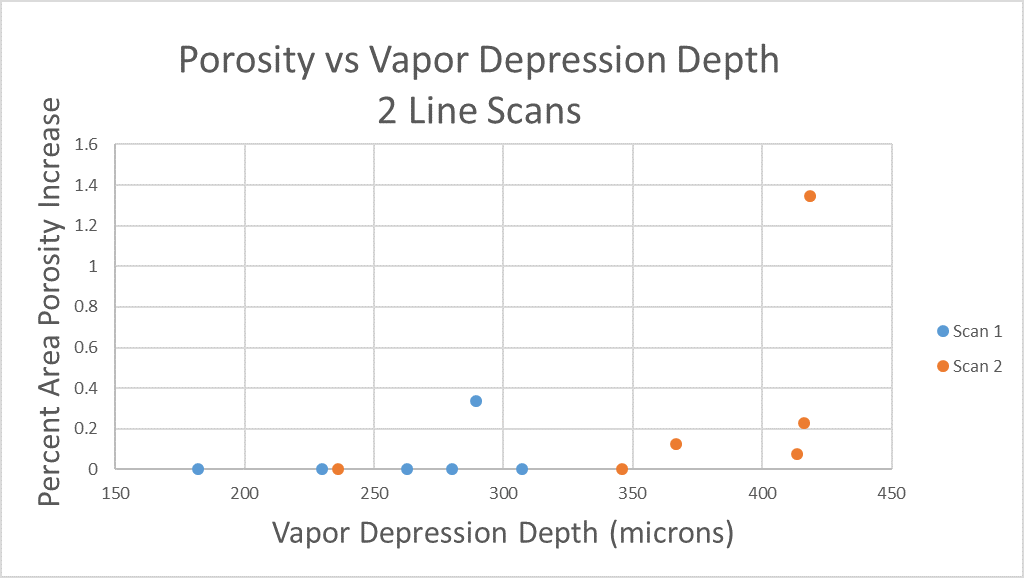
As can be seen, only 1 of the 6 samples display an increase in porosity after the first scan, but 4 of the 6 samples shown an increase in porosity after the second scan (Figure 11). Also, all but one of the scan 2’s have a greater vapor depression depth than the first scan, indicating that this increase in porosity formation is due to an increase in vapor depression depth (Figure 11). There is a statistical significant increase in the vapor depression depth, with the mean being a 107.6 micrometer increase in vapor plume depth, with a standard deviation of 16.4 micrometers, resulting in a 95% confidence interval of 74.9 microns to 140.3 microns.
Unfortunately, I have not been able to transform this information into anything useful for the purpose of detecting keyhole formation with IR. I have made several attempts at potential low hanging fruits, comparing profiles of temperature along the scan line as well as the spot size as seen in the IR camera to the vapor depression width and depth, but have achieved nothing of note at this point. There are still other methods which could be fairly simple to make an analysis out of, as well as much more sophisticated methods which could be used to attempt to find such a correlation. This will be one of the aims of future work.
Advancements in Desalination Technologies: Applications of Electrodeionization
Hello! My name is Caroline Kaden and I am a rising senior studying chemical engineering. This summer I was able to work in the Advanced Materials Division of Argonne National Laboratory, more specifically within the Water-Energy Nexus with Dr. YuPo Lin. Water plays a crucial role in energy and fuel production, from usage in power plant cooling towers, to fracking, to acting alone as a renewable source by hydroelectric power. Similarly, energy is needed to produce usable water from various sources. Pumping, desalinating and distributing water all require energy. Factors such as climate change, and regional variance including population, geography, weather, and occurrences of natural disasters all contribute to the importance of the Water-Energy Nexus because these factors can shift water and energy demands greatly and unexpectedly over short periods of time.
One of the most consumptive and least efficient processes is thermoelectric cooling. Focusing on the optimization of this could therefore greatly decrease water and energy use. More specifically, minimizing the energy used to desalinate water as well as having more usable water for cooling towers will make a large difference in the Water-Energy-Nexus because cooling towers account for almost 50% of interdependent water withdrawal within the US. The inefficiencies of cooling towers are that high mineral, contaminant, and salt content promote scaling therefore decreasing functionality, the blowdown water can be very difficult to treat or dispose of due to high salinity and contaminant content, and even with heavy monitoring, withdrawal of water for make-up usage is very large and increases the impact within the nexus.
However, Electrodeionization (EDI) technology can help solve these issues. EDI is a far more energy-efficient and economical pretreatment than previous water treatment solutions, which means blowdown frequency can be reduced. Sea water, brackish water, produced water and treated municipal effluents are all possible candidates for makeup water if treated sufficiently and economically, and reduce the amount of freshwater needed for makeup water in the cooling tower. These solutions are largely beneficial as developing and optimizing water reuse technologies can reduce cooling tower water consumption by up to 40%.
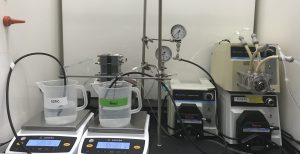
This summer I did research specifically working with removing silica from water. Silica is especially difficult to remove because it is almost always present in both the reactive and unreactive forms and it is nearly impossible to control which form is present. Additionally, the solubility is affected by time, pH, and temperature. The experiments I ran involved building an EDI stack, with resin wafers inside to promote ionic transport. I then pumped a silica solution through the system as a batch operation, taking the conductivity and pH of both the feed and concentrate regularly to analyze the concentration. The set up is shown below. The EDI stack is in the back left.
I found that silica does not move through the tower as easily as salt, as not all of the silica originally put into the system is accounted for in the feed nor the concentrate at the end of the experiment. I hypothesize that the the silica being adsorbed onto the resin beads. Because of this, the next steps to take include: changing components out, such as using different resins and/or different membranes to better promote silica transfer to concentrate stream, changing operating conditions such as flowrate, voltage applied, and running continuous feed of silica solution to test for a steady-state point of separation.
Overall this summer’s work was very rewarding and interesting as it combined my background in chemical engineering with my interest in sustainability and I look forward to seeing where EDI and separation technology lead to!
Characterizing Tagged Cytochrome P450 Enzymes
Hello, my name is Joseph Draut, I’m a rising senior at Northwestern University studying chemical engineering. This summer, I’ve been working on a collaboration between the Tullman-Ercek lab and the Tiede lab, investigating cytochrome P450, an enzyme capable of carrying out oxygenation reactions on inactivated carbon-hydrogen bonds – a reaction that is challenging to carry out with chemical catalysts. This chemistry is particularly useful in generating industrially valuable compounds like linear alcohols, amines, or steroids. Ultimately our project seeks to investigate functionalizing P450 through modifications that would make the protein more efficient. Since P450 is relatively unstable in the cytoplasm, selectively localizing the protein to a more amenable environment may improve protein functionality. Towards this end, the Tullman-Ercek lab has added a tag (a small amino acid sequence) that drives the localization of the protein to a microcompartment – a small protein “cage” so to speak. The addition of this localizing tag alters the amino acid sequence of the protein and could therefore potentially alter the functionality. Thus, my work this summer has aimed to determine whether tagging P450 alters its functionality compared to the wildtype (untagged).
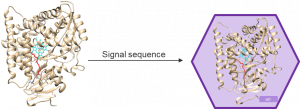
Figure 1. Cartoon depicting the localization of P450 to bacterial microcompartments after addition of a short localization sequence to the protein.
Throughout the summer, I have been able to optimize an expression strategy for P450 in E. coli and purifying using fast protein liquid chromatography (FPLC). I have further validated the activity of our tagged P450 on varied chain ethers and found it comparable to the wildtype. In the interest of using electron paramagnetic resonance (EPR) – a technique that interrogates unpaired electron systems – to further characterize our P450 variants, I quantified the robustness of P450 to freeze-thaw cycles, as EPR requires sample freezing. With these tasks done, I intend to carry out EPR based experiments in my remaining time at Argonne.
Coming from a cell-based devices background, this summer I wanted to learn about other domains of biology research and how synthetic biologists and biochemists can collaborate to apply diverse knowledge and experiences to further biological interrogation and application. I have gained a multitude of new skills and furthered my horizons in the research space, all of which I will carry with me in my future endeavors.
Mimicking Proteins: Heme and Copper Binding in Peptide Amphiphiles
Hello, my name is Ari Jacobson and I am a rising senior at Northwestern University studying in Integrated Science, Biomedical Engineering and Computer Science. This summer I am working with Dr. H. Christopher Fry under lead scientist Dr. Gary Wiederrecht in the Nanophotonics & Biofunctional Structures group at the Center for Nanoscale Materials at Argonne National Laboratory.
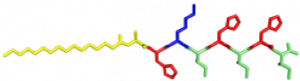
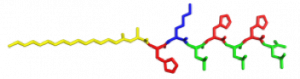
In the Nanophotonics & Biofunctional Structures group many of the projects seek to create functional nanomaterials that are inspired by functions in nature. One of the projects I worked on used peptide amphiphiles (PAs) to bind heme porphyrin and transition metals. This project gets its inspiration from nature, where there exist enzymes which bind heme and copper in order to complete electron transfer and that can exhibit catalytic properties. Our PAs are synthesized by solid phase peptide synthesis using an automated synthesizer. They consist of a peptide sequence capped with palmitic acid at the N-terminus of the . These PAs self-assemble in water, sometimes dependent on pH, and can form supramolecular structures including micelles, ribbons, fibers, and sheets. The peptide sequence at the end can be selected to be bioactive and exposed on the exterior of the nanostructures.
In my project, I compared two peptide sequences and used a variety of spectroscopy techniques to probe heme, copper, and nickel coordination with the amphiphiles. We used PAs with sequences C16-AHKIHIHI-CONH2 (IHIHI PA) and C16-AHKLHLHL-CONH2 (LHLHL PA). These are designed with a histidine towards the hydrophobic region in order to bury a bound heme molecule, and two histidines towards the hydrophilic region to bind copper, nickel, or potentially other transition metals. I hypothesized that using leucine instead of isoleucine in between the histidines would create a more flexible backbone which would increase the efficiency of binding, and binding both heme and a transition metal.
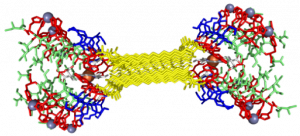
My findings suggested binding of both copper and heme for IHIHI PA. We confirmed heme binding with UV-vis spectroscopy, as we saw a peak at 425 nm when the sample was heated, as we were able to show an effect on the secondary structure of IHIHI PA when copper is added to the solution using circular dichroism (CD), a change in morphology via atomic force microscopy (AFM), and a change in the binding of heme after copper has been added via UV-Vis spectroscopy.
With our LHLHL PA, we were similarly able to show heme binding with heat, showing a peak in UV-Vis at 425 nm. We were not able to see a secondary structure change upon the addition of copper, but we were able to see a change in heme binding when copper was added first, as there was a blue shift in the spectra when more copper was added, eventually showing no heme binding when enough copper was added. This indicates that copper is interacting with our peptide.
From the data I collected this summer using a variety of spectroscopy techniques, we are able to see that copper interacts with both peptides. We are not, however, able to confirm that copper and heme are bound at the same time when heme is added first. In order to further understand this, electron paramagnetic resonance (EPR) spectroscopy must be performed. Once this binding is better understood, it will be possible to further optimize the system and characterize any catalytic or electron transfer capabilities this system may hold.
I am grateful for the opportunity that I had at Argonne National Lab this summer. I would like to recognize the work of Dr. Jennifer Dunn at Northwestern – Argonne institute of Science and Engineering and Dr. H. Christopher Fry at the Center for Nanoscale Materials for their work this summer in making this possible and mentoring me.
Using 3D Printing to produce sub-millimeter sized structures
Hi, my name is Anant Gururaj and I’m going to be a senior at Northwestern. This summer I’ve been working in the Applied Materials Division with Kaizhong Gao. I’m using 3D printing, specifically Finite Deposition Modelling, to develop a device intended to interact with particulate matter in liquid and gaseous streams. I’m not allowed to discuss specifics or show any prototypes I’ve developed, so I’ll be focusing on the two biggest challenges I’ve faced. These are minimizing printing time, especially for circular geometries, and achieving print thickness of less than 1mm.
I’m using Finite Deposition Modelling (FDM) to create our device. Other techniques are available but FDM is cheap and more widely used than others. Plastic (ABS) filament is fed to heated extruder where it melts. The extruder then deposits plastic onto the (heated) build plate layer-by layer to create a 3-D structure. Temperature of the extruder and plate, and print speed parameters can be controlled.
The design of the device calls for the construction of several rods, with each rod being designed to ensure the maximum surface area to volume ratio. I’m considering only rods with circular and square cross sections, and in either case, minimizing the diameter/side length of the circular/square rod results in maximizing the surface area to volume ratio.
Orientation of the object on the build plate made a massive difference to the print time (below). With circular rods, however, after the first layer is printed, subsequent layers will have overhanging regions that will drip onto the build plate, so orienting circular rods horizontally (which cuts down printing time significantly) on the build plate is not an option, and I only looked at square rods going forward.
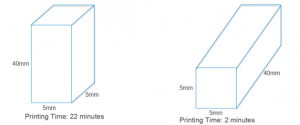
In terms of minimizing print thickness, the minimum thickness achievable was 0.5mm, due to the printer’s nozzle width being 0.5mm. In fact, the software used by the 3D printer refused to process any structures that had dimensions less than 0.5mm. So I tried printing a rod with a cross section with a 0.6mm side length, and upon measuring it found that its dimensions were 0.75mm x 0.44mm. This deformation is likely due to the ABS ‘sinking’ under its own weight, as it is not completely solid when released from the extruder.
The 0.75mm x 0.44mm rod I printed was a singular rod, so the next logical step was investigating whether I could recreate those dimensions with more complex arrangements of rods, which would be needed in creating the device. Unfortunately, I can’t show any pictures of the prototype I made, but I found that when arranged in more complex configurations, the rods that were printed had dimensions closer to the intended 0.6mm x 0.6mm, but there was still some deformation.
Going forward there are other 3D printing techniques, such as Stereolithography, that could be used to produce rods with smaller dimensions much more precisely. These methods are, however, more expensive. Smaller nozzles could also be used, but these can also be expensive.
Evaluating Steel Performance Using Evolutionary Algorithms
Student: Yichun Li, Northwestern University
Principal Investigator: Mark Messner, Argonne National Laboratory
- Introduction
Grade-91 Steel was developed around 30 years ago. Now a new design of nuclear reactors has been proposed and under review. Water was originally used as a moderator and coolant in existing nuclear reactors. Now liquid sodium has been considered as the new coolant because designs have forgone water as a coolant. However, steam is still used to transform the energy from nuclear reactions to electricity. Therefore, the new design adds in an intermediate heat exchanger with both water and liquid flowing through to perform the heat exchange process. In turn, the materials used for building the heat exchanger has been Grade-91 steel. However, such steel has not been used in such structure in the nuclear reactor before, therefore it is important to understand and examine its properties, such as stress and strain, and performance, especially under the condition of high temperatures. The designed proposed life of the steel for the heat exchanger is 60 years. However, there has not been enough research on this topic. Therefore, this project is to fill in the gap, by looking at the experimental data of such steel under different physical parameters under stress and strain. There are two other materials, though having less data that are considered for the same project.
The original goal of this project was to utilize machine learning techniques to configure a model that will help us understand the performance (deformation under high temperatures) better.
- EA (Evolutionary Algorithms): ODE-based models
- RNN (Recurrent Neural Network): Use the synthetic model to train and run the model first before using the big dataset.
Due to time constraint, a completion of EA on a simulated dataset was achieved. The following is the general timeline:
Week 1-4: Building and debugging the EA algorithm using DEAP package;
Week 5-9: Testing the algorithm on simulated datasets and analyzing results;
Week 10: Final wrap-up.
- Setup
- Data Processing (scaffold.py)
The file includes functions to read and load entries from a dataset of 200 experiments, parsing them and putting them into an evaluative model to assess individuals.
The fitness of the evaluation(R) is a Euclidean norm summation over all experiments. For purpose of fitting into the DEAP package, the goal of the algorithm instance is to maximize fitness(F), where , where F will take values between 0 and 1 (inclusive).
Additionally, a penalty (R = 10000) is added when evaluating F, which despite its mathematical bound, could result in invalid values. In those cases, the fitness of that individual will be set to the penalty, which will result in the individual being eliminated for selection of the next generation.
- Algorithm Build(small.py)
DEAP package is a Python package built for Evolutionary Algorithms. small.py is the file that implements an instance of an Evolutionary Algorithm using DEAP. The structure of the instance is as follows:
- Registering the algorithm to maximize fitness, an individual and a population that is made up of certain numbers of individuals into the instance toolbox. An individual is a list of attribute values with a fitness class and a population is a list of those individuals. In an individual, the attributes in order represents, E(Poisson’s Ratio) ranging from 0 to 300,000; Sy(Yield Stress) ranging from 0 to 1000; H (kinematic hardening modulus) ranging from 0 to 120,000; K (isotropic hardening modulus) ranging from 0 to 120,000.
- Registering evolutionary methods into the instance toolbox, namely:
- Mutation: functions that will mutate and generate a new offspring from an individual in the population.
- Crossover(mate): functions that will mate and reproduce a new offspring from two individuals in the population.
- Selection: functions that will select a pre-determined number of individuals from the offspring or both offspring and old individuals in the population.
- Setting up the selected algorithm with parameters as follows: number of experiments used to evaluate the individuals, number of individuals, maximum number of generations, number of individuals selected to be in the next generation as will as an statistics object that records mean, standard deviation, minimum and maximum for each generation.
- Methodology
The core idea of this optimization using EA is to find the best feasible algorithm, the best method for mutation, crossover and selection, where probabilities for the methods need to be tested and adjusted.
For algorithms, the following have been tested:
- OneMax (similar to eaSimple in DEAP): both mutation and crossover is performed in every individual, and replaces the entire population with resulting offspring.
- Evolution Strategies (using eaMuCommaLambda algorithm): either mutation or crossover is performed on a select amount of individuals to produce a determined number of offspring. Then, the next generation is selected only among the offspring. For crossover and mutation, the strategy restrains the standard deviation of the offspring.
- eaMuPlusLambda: either mutation or crossover is performed on a select number of individuals to produce a determined number of offspring. Then, the next generation is selected among both the offspring and the parents.
For crossover, the following functions have been tested:
- cxTwoPoint: individuals swap two of their attribute values.
- cxUniform: individuals conditionally swap every attribute depending on a probability value.
- cxESBlend: individuals swap attribute both attribute and strategy values.
- cxSimulatedBinaryBounded: the attribute values will be converted into binary sequences, which the function will crossover the sequences and generate an attribute value. A lower and upper bound for each attribute value (same bound as initial setup), as well as a crowding degree of how much the resulting value will resemble the parental value, need to be set.
For mutation, the following functions have been tested:
- mutFlipBit: convert the attribute value into a binary sequence and perform NOT operation. An independent probability for each attribute to be flipped needs to be provided.
- mutShuffleIndexes: shuffle the attribute values inside an individual. An independent probability for each attribute value to be exchanged to another attribute needs to be provided.
- mutESLogNormal: mutate the evolution strategy according to an extended log normal rule. Then the individual attribute values is mutated according to the generated strategy as standard deviation.
- mutPolynomialBounded: mutate the attribute values using polynomial mutation as implemented in NSGA-II algorithm in C by Deb.
For selection, the following functions have been tested:
- selTournament: select k individuals from the population using k tournaments.
- selRoulette: select k individuals from the population using k spins of a roulette.
- selBest: select k best individuals from the population.
- selWorst: select k worst individuals from the population.
In addition, the following parameters are tested:
- MUTPB and CXPB: the probability of an individual going through mutation and that of crossover. The summation of both needs to be smaller than 1.
- Indpb: the independent probabilities of each attribute to be changed in terms of crossover and/or mutation.
As the goal is to maximize fitness, the goal is to generate an individual with the fitness(F) value of 1, which is R value of 0.
- Results and analysis
Initial Fitness
Maximum fitness is the most important statistics in the fitting process. Initial mx fitness varies proportionately to the number of experiments, which will extend the number of generations needed to converge to F valuing 1.
| Number of Experiments | 5 | 50 | 100 |
| Average Max Initial Fitness(F) | 0.25 | 0.03 | 0.01 |
Because of that, the penalty in scaffold.py needs to be a very big number in order to exclude individuals with very “bad” fitness.
On an additional note, the fitting process did not exact follow a systematic fashion as the number of experiments as well as the number of individuals in the population affects the time for each trial to finish.
Premature Convergence
Premature convergence was a significant issue with a big part of the fitting process, which means that the population tends to get stuck on a local maxima for F, resulting in a very low and consistent standard deviation as well as max F around generation 15. Most of the crossover methods tend to decrease the diversity of the population, as follows:
| Methods | Influence on diversity |
| cxTwoPoint | Same as mutShuffleIndexes |
| cxUniform | Same as mutShuffleIndexes |
| cxESBlend | Same as mutShuffleIndexes |
| cxSimulatedBinaryBounded | Will maintain a good diversity. |
| mutFlipBit | It can produce values that are potentially outliers. The issue is that it could generate invalid values. |
| mutShuffleIndexes | Shuffling does not necessarily bring in new values into the attributes pool, which will make the algorithm hard to converge to a right F. |
| mutESLogNormal | The range of values upon mutation depends on the strategy value. |
Another factor playing into premature convergence is the values of CXPB, MUTPB and indpb, as mentioned towards the end of the previous section. From the trials, it was also very apparent that mutation performs better than crossover in terms of increasing or maintaining a healthy diversity in the population. However, a heavy tilt towards mutation could result in the algorithm having a hard time locking up the correct direction to increase the fitnesses of most individuals, which will result in outliers and some hopping around. Therefore, having roughly a 0.4:0.6 for the CXPB:MUTPB is good ratio.
In addition, indpb dictates how possible is each attribute value likely to crossover/mutate. In that case, the probability of a single attribute to be mutated is usually: indpb * CXPB or indpb*MUTPB. Maintaning a high indpb (0.9) will help crossover and mutation in maintaining diversity as well as evolving the population correctly and timely.
A third factor for premature convergence is the relationship between the number of experiments and the size of the population. With 5 experiments, population of size 50 is a good number that will allow evolution to happen. With 100 experiments, population of size 400 will do the same. The following table shows the best performance of population under 5 experiments versus 100 experiments using eaMuPlusLambda:
| Number of Experiments | Population Size | Initial Max F | Final Max F | E | Sy | H | K |
| 5 | 50 | 0.2642 | 0.9739 | 199807.2398 |
299.9368 |
3172.1629 | 3856.7229 |
| 100 | 400 | 0.0172 | 0.9999 | 200000.0000 | 300.0000 | 2999.9999 | 4000.0000 |
It is apparent that with more experiments and a much bigger population size, the algorithm is able to fit the model really well.
Results of different algorithms
There was no recorded statistics for trials done with OneMax algorithm, however, based on recall, the algorithm did marginal improvement to the initial avg max F.
The following table is a comparison between the other two algorithms:
| Algorithm Tested | Initial Avg Max F | Final Avg Max F | Change |
| Evolution Strategies (eaMuCommaLambda) | 0.1896 | 0.2769 | 66.06547% |
| eaMuPlusLambda | 0.06702 | 0.7246 | 981.1407% |
For both OneMax and Evolution Strategies, experiments were not able to run past 25 generations because of the value error triggered by individuals with very “bad” fitness. However, both algorithms encounter premature convergence. Regardless of the number of experiments used as well as the size of the population, eaMuPlusLambda performs better than the other two. The reason might be that the other two both have, to a certain degree, an exclusive selection rule. Both algorithms, upon selection, replace the old population exclusively with offspring. This could potentially be problematic for the following reasons:
- The parents with “good” fitness in the old population are not allowed onto the next generation, which might slow down the evolution.
- The selection measure would allow more offspring with “bad” fitness to be in the next generation, which might slow down the evolution.
See Appendix for graphs on individual trials.
- Conclusion and Future Development
In conclusion, the evolutionary algorithm could fit the parameters of stress and strain rather well in order to predict a set of physical parameters that will work under the given experimental data. The following key components are important to building the algorithm that work well:
- A big population
- A balanced crossover-to-mutation ratio that can maintain a good diversity in the population
- A selection measure that will be comprehensive
Given time, Evolution Strategies could be further studied to fit the model well as it learns and modifies the evolution according to the distribution of the individuals. Furthermore, we could use optimization measure in scipy package to benchmark against the performance of EA. RNN could be developed and trained to fit the model as well. Also, trying to fit a more complex model with more attributes could be valuable.
Northwestern Undergraduates: Plan now for a Summer 2018 internship at Argonne National Laboratory through DOE’s Summer Undergrad Lab Inhip (SULI) programterns
In 2017, Northwestern undergraduate students worked on the projects you can read about on this blog at Argonne National Laboratory. The U.S. Department of Energy’s (DOE) Summer Undergraduate Laboratory Internships (SULI) program is one route to working at Argonne (or another national lab) over the summer. (Although other routes are possible to summer internships at the lab, this is the best one for undergraduates.) The deadline for summer 2018 will be in Dec/Jan so now is the time to start thinking about applying! Watch this space for the deadline when it is announced.
Participation in the SULI Program is a great way to get a taste of research and life at the national laboratories. You’ll meet national laboratory researchers and many other undergraduates carrying out research in many disciplines. Please apply to the SULI program through this DOE website link:
https://science.energy.gov/wdts/suli/
Argonne PIs have provided descriptions below about projects that will likely be available in 2018. Many other projects will also be available. As you complete your SULI application, you’ll be asked about your research interests. Please feel free to mention the topics in one of the projects below if they meet your research interests. Please let NAISE know if you’ve applied (naise_summer(at)northwestern.edu).
Some details: SULI students can live on-site at the lab. You must be a U.S. Citizen or Lawful Permanent Resident at the time of application.
Biology
Fe and S cycles’ role in contaminant mobility
Research in the Biogeochemical Process Group at Argonne National Laboratory is investigating the interplay between the Fe and S cycles and their roles in controlling contaminant mobility, carbon and nutrient cycling, and greenhouse gas emissions. The project’s long-term vision is to integrate their findings into multiscale modeling approaches to understand and predict relevant environmental processes. The program integrates two unique strengths—(1) the Advanced Photon Source (APS) for synchrotron-based interrogation of systems, and (2) next-generation DNA sequencing and bioinformatics approaches for microbial community and metabolic pathway analysis—with biogeochemistry and microbial ecology.
Bioinformatics and Computational Biology
We apply a wide range of computational approaches within the DOE Systems Biology Knowledgebase (KBase) to answer questions about complex biological systems, including: (i) how microbes and plants degrade or produce specific metabolites; (ii) how microbes, plants, and fungi interact within an environment (e.g. human gut, soil, bioreactor) to display a specific phenotype; and (iii) how microbial genomes evolve in response to stress, stimuli, and selection. Students in the Henry lab will learn to apply tools like (meta)genome assembly, genome annotation, RNA-seq read alignment, contig binning, and metabolic modeling to answer these questions. Students with programming skills can also contribute to the KBase platform by integrating new apps, visualizations, and algorithms.
Materials
The goal of the project is to significantly improve the understanding and prediction of thermodynamic stability/metastability of “imperfect” (e.g., highly defective, non-stoichiometric, or doped) oxide material phases, via innovative theory (i.e., embedded uncertainty), advanced experiments at APS, and “intelligent” software (i.e., able to learn and quickly solve new problems). We envision building the knowledge and capabilities that will allow, over the next decade, the prediction of thermodynamic properties of imperfect materials, with impact on materials design, synthesis, and smart manufacturing. Furthermore, we expect this methodology to accelerate the development of the material genome and next generation computers. We focus on high-k dielectric materials for complementary metal-oxide-semiconductor (CMOS), which are of particular importance for creating Dynamic Memory Allocation (DRAM) devices. Many CMOS properties strongly depend on material defects such as vacancies, interstitials, defect clusters that occur during synthesis, and thermal treatment. Inclusion of other chemical elements (e.g., dopants) in CMOS can significantly change physical properties such as thermal conductivity, electrical conductivity, and magnetism. Our approach is original and is based on calculating the free energy of each phase as function of temperature and composition (oxygen and dopant content) using atomistic (quantum mechanical, ab-initio Molecular Dynamics), meso-scale (reactive force fields and kinetic Monte Carlo), and continuum (phase diagram calculation) methods. Uncertainty evaluation is embedded in this multi-scale methodology via Bayesian analysis. We validate the models and computer simulations using high-temperature experiments at APS. Furthermore, we develop a machine learning (ML) open code to perform supervised and unsupervised computations on Mira (Aurora when available) for calculations/simulations, and on Athena for big data analytics. The intelligent software assists the development of interatomic potentials and force fields, performs analysis of massive sets of CMOS phases and defect structures, evaluates uncertainty of phase diagrams, and guides the experimental characterization measurements.
Chemical/Environmental Engineering
Bio-manufacturing of Porous Carbon as Catalyst Supports from Organic Waste Streams
Porous carbon materials, like activated carbon (AC), have demonstrated unmatched efficiency in applications such as filtration, catalysis, and energy storage. The problem is that conventional AC is produced from supply limited coal or coconut shells using multistage manufacturing processes that are energy intensive, polluting, and result in sub-par performance. In fact, an estimated 4 million metric tones of AC will be produced in 2025, requiring the harvesting and shipping of significant feedstock from around the world. We have been developing a biomanufacturing process to produce high performance, low cost porous carbon materials from low or negative value waste streams. High performance biocarbon manufacturing process (Patent App. No. PCT/US 2017-043304) has been scaled up from bench- to pilot-scale. The performance, cost, and life-cycle impact of AC and its end-uses are primarily determined by how it is fabricated.
Arrested Methanogenesis for Volatile Fatty Acid Production
Huge quantities of high organic strength wastewater and organic solid waste are produced and disposed of in the US each year (EPA, 2016). We have been developing a new high rate arrested anaerobic digestion (AD) processes for transforming organic waste supplanting starch, sucrose or glucose currently used as feedstock into VFAs and alcohols. We will design and construct a high rate sequencing batch reactor (SBR) and fluidized anaerobic membrane bioreactor (FAnMBR) technologies to produce and separate VFAs and alcohols from the fermenters to facilitate high product yield, minimize the toxicity of VFAs, reduce mass transfer limitations and ensure the health, stability, and productivity of AD communities. This research will specifically determine the links between organic wastewater characteristics, microbe community structure and the design and operation of high rate arrested AD system at the bench-scale. Specific research targets include the isolation and integration of highly diverse microbial functionalities within high rate arrested AD fermenters for high strength organic wastewater treatment coupled to renewable chemical production.
Ecosystem, Environment, Water Resources
Ecosystem services of bioenergy
The Fairbury Project studies sustainable ways to produce bioenergy and evaluates the dual provision of biomass (as a commodity crop) and ecosystem services (environmental benefits) through the integration of short rotation shrub willow buffers into a Midwest row cropping system. The project started in 2009 on a 16 acre agricultural corn field in Fairbury, IL. The field site is close to the Indian Creek which sits at the headwaters of the Vermillion River, considered impaired by the Illinois EPA. The strategic placement of the willow buffers on the landscape was designed to improve land use efficiency by providing farmers and landowners with an alternative land management strategy. In this case, the placement of the willow buffers were to target areas on the field that would have the greatest impact on nutrient reduction while mitigating conflicts with grain production by targeting areas that are underproductive as well. In order to assess the success of the use of willow buffers in a traditional row-cropping system on biomass production and ecosystem service provision, many field and crop based parameters are continually or annually measured. These parameters include assessing crop impact on water quality (water collection, ion exchange resins), water quantity (soil moisture, transpiration and water table elevation), nutrient uptake and storage (vegetation collection), biomass production (vegetation collection and allometric measurements), soil health (chemical & physical parameters), greenhouse gas flux (gas sample collections), and habitat provision (soil microbiology and macroinvertebrates including pollinators).
Student involvement:
As part of The Fairbury Project, students will work alongside Argonne staff and fellow interns doing an array of tasks in the field, lab, and office. Students are expected to travel to the field once or more a week under various weather conditions for data and sample collection. In the lab students may be involved in sample processing and analysis including ion exchange resin extraction, water quality testing (UV spectroscopy), greenhouse gas analysis (gas chromatographer), aboveground vegetation processing, and root analysis. In the office, students will be tasked with processing and analyzing data using software including but not limited to excel, R, DNDC, and ArcGIS. Additional tasks may include literature reviews and method development. Students will work both collectively with their fellow interns and staff as well as independently on various assigned tasks.
Qualified candidates:
Candidates must meet the general requirements for SULI. Additional requirements include but are not limited to previous experience or general interests related to water, soil, greenhouse gases, biodiversity, bioenergy production, environmental engineering, environmental sciences, and agriculture. Candidates should have a flexible schedule over the 10 weeks of the internship and must be available for the full 10 weeks. Field days start at 6am, therefore qualified candidates are required to have some form of transportation to the lab on field days (transportation from the lab to the field site will be provided), if not living on site.
Water Resources- Fuel production
Water resource is a critical component in energy production. Water resource availability varies by region throughout the United States. Population growth, energy development, and increased production increase pressure on water demand. This project evaluates potential of using ground water resource and municipal wastewater for fuel production in the United States. It will examine various level of water quality and estimate the water available for use from both historical production and future production perspective. Factors affecting regional resource use, feedstock production, and technology deployment and their trade-offs will be analyzed.
Water Resources- Crop production
Agriculture crop production requires water. However, not all of the crop production requires irrigation and the irrigation needs for the same crop varies from region to region. This project will analyze the amount of fresh water used for irrigation by different crops and irrigation technology surveyed in last few years in the United States. Spatial and temporal analysis will be conducted to calculate amount of irrigation water applied to produce a unit of grains and other products. The dataset will be compared with historical irrigation data to identify potential issues related to production of food, fiber, and fuel.