Author: James Shengzhi Jia, Northwestern University, rising sophomore in Industrial Engineering & Management Science
Imagine if you are a researcher here at Argonne, and you don’t have to go upstairs downstairs all the time just to check the experiments that you are running — all you have to do is sit in front of the computer, monitor and control all of them in one system. Wouldn’t that be amazing?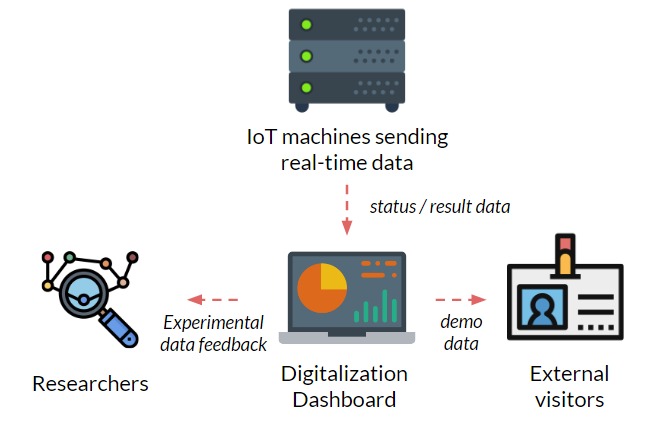
Figure 1: Schematic of the project motivation
Before this internship, I couldn’t possibly imagine such a scenario. However, during the summer, I was working with my mentor Jakob Elias at Energy and Global Security Directorate and creating the beta infrastructure of the system that can connect and visualize real-time data from IoT machines at Argonne, and achieve automatic optimization of experiments.
The following short videos demonstrated the beta infrastructure that I created. It’s easy to navigate through the interactive map, and obtain key information about the areas, buildings, rooms and experiments that are of your interest. The dashboard is able to receive data from the local system, websites and also MQTT protocol. In the future, we plan to integrate various AI applications into the dashboard, so it becomes even smarter and grants researchers full control of their experiments right in their office. 
The second part of my work is testing the usability of this dashboard by using the metal 3D printing experiment in Applied Materials Department (AMD) as a test case. Let me give you a brief introduction of the experiment and their objective: (Full explanation can be seen in Erkin Oto’s past post)
AMD researchers at Argonne utilize powerful laser beam, X-ray and IR to conduct metal 3D printing experiments, and the key objective is to characterize and identify the product defects. However, as X-ray machines (which are used to identify defects) are not as ubiquitous as IR machines, researchers at Argonne are exploring whether it’s possible to only use IR data to identify the defects in the products.
Firstly, as each experiment generates over 1000 IR images, I created a MATLAB software that speeds up the analysis of those images to just within 10 seconds. As shown below, the software works to transform an original black IR image to a fully colored image that researchers can select pixels-of-interest on.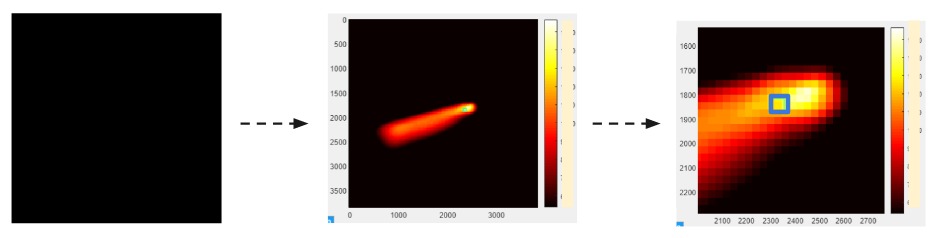
Secondly, additional to the processing tool, I also programmed an analytical tool (which can be seen below) to quantitatively analyze the defect / non-defect dataset. In the process, I came up with two original methods to investigate the correlation, and applied Kernel Gaussian PDF Estimation, Mann-Whitney U Test, and Machine Learning via logistic regression. 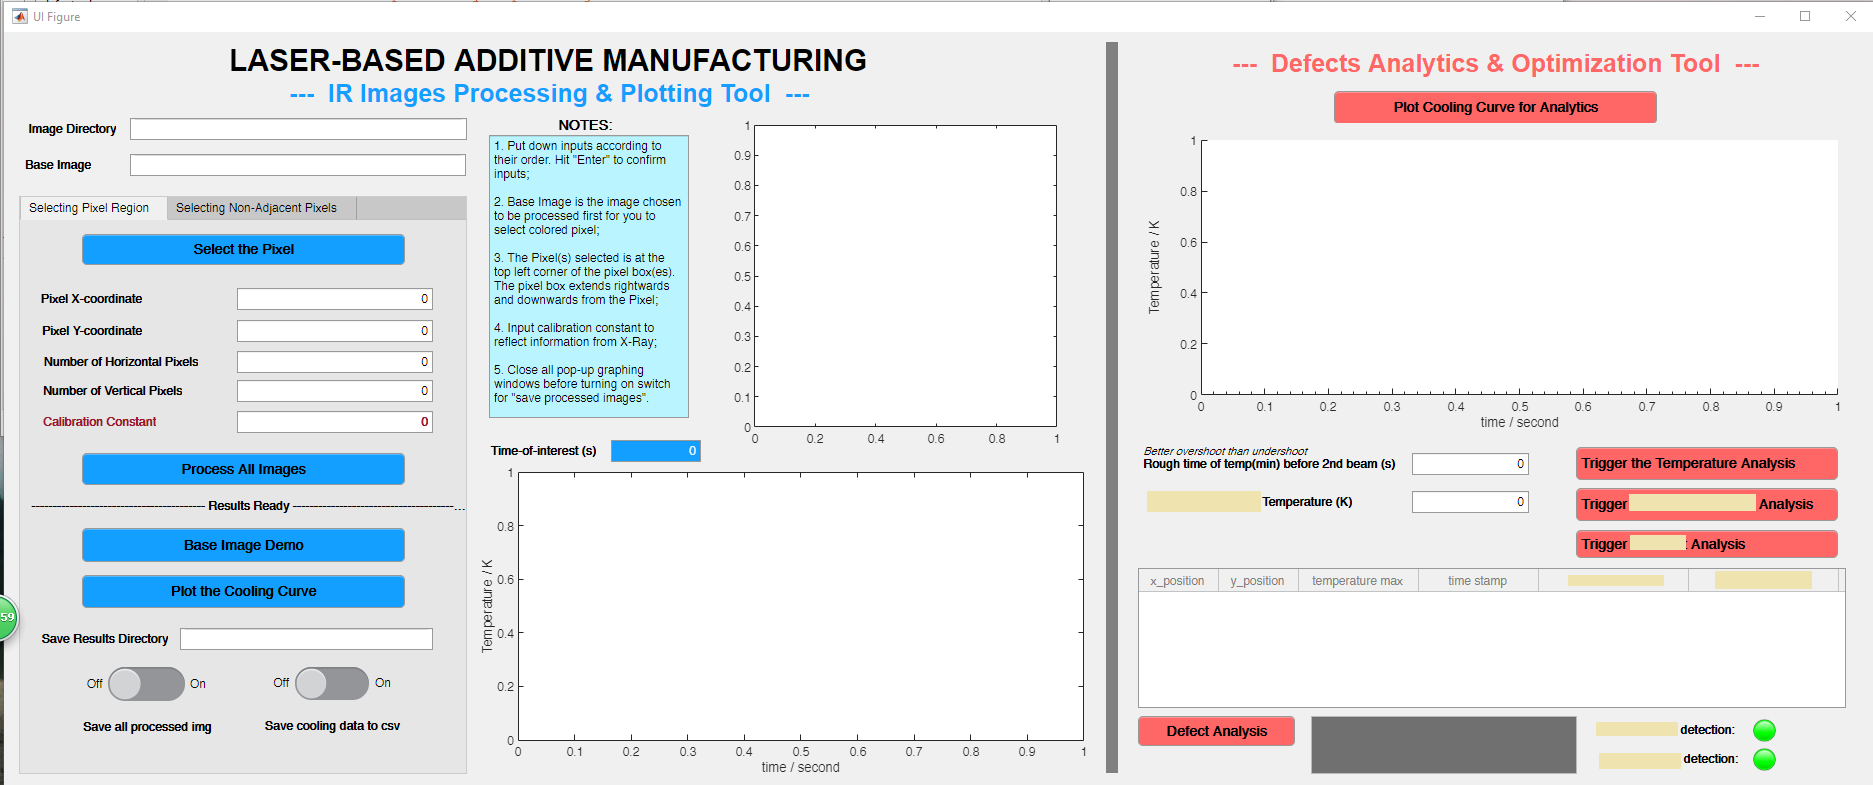
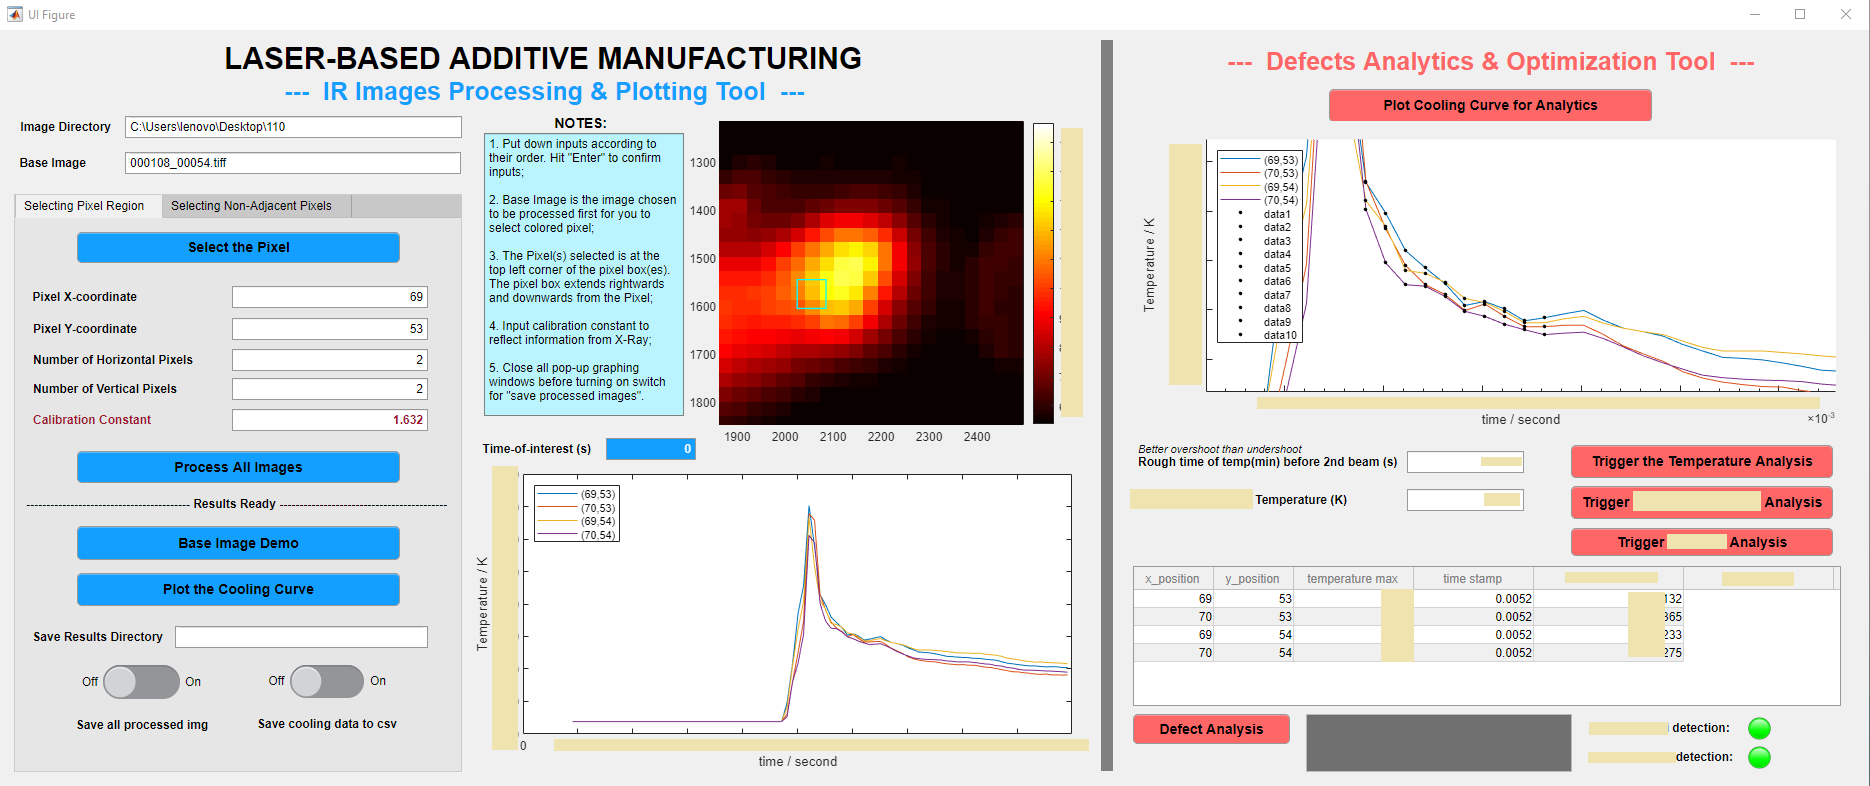 Based on the original methods that I developed and therefore the machine learning model trained, the accuracy of the model reaches 86.3%, with p values for both method coefficient below 0.1.
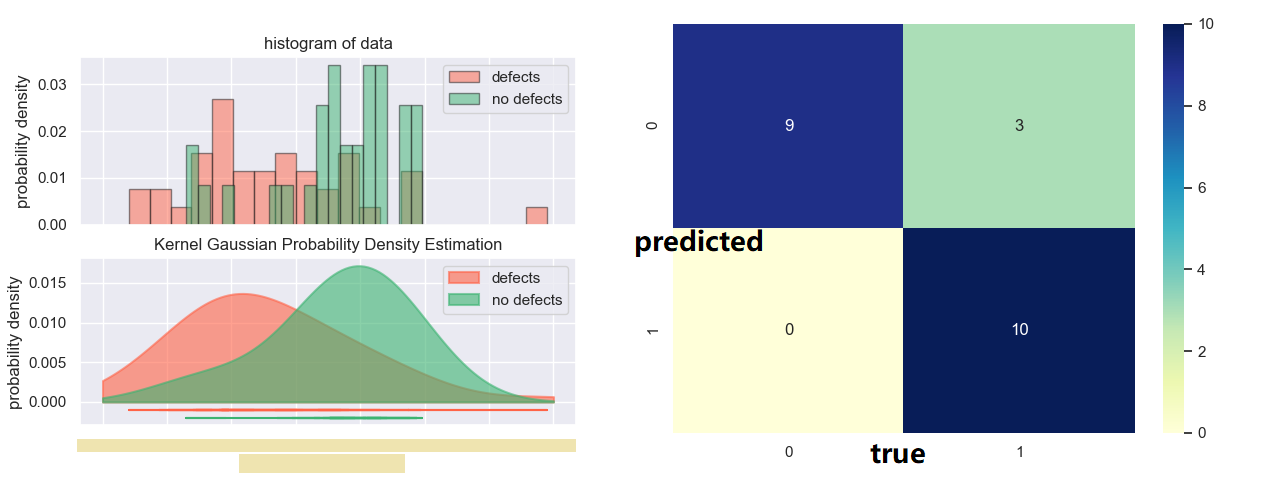
In the future, more efforts can be put into obtaining more accurate data, to improve the model. In a bigger picture, we can also explore about integrating applications like this into the dashboard, and achieve the digitalization of Argonne National Lab in the near future.
Disclaimer: all blocked image data are intended to protect the confidentiality of this project. Unblocked data are either trivial or purely arbitrary (such as ones in prototype dashboard).